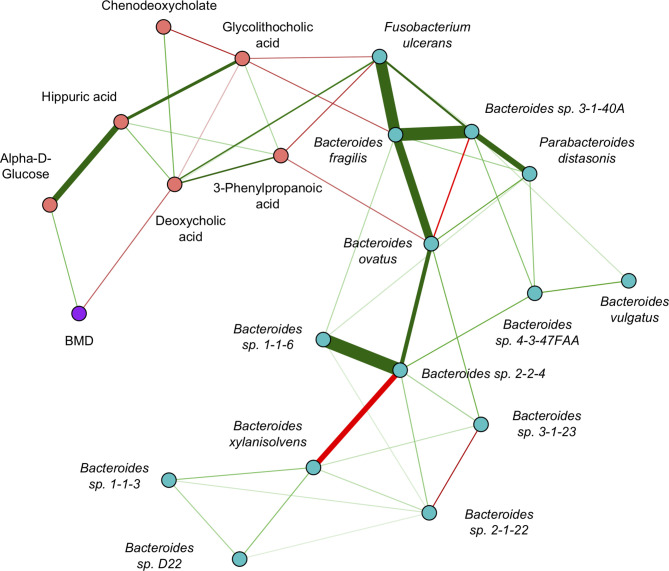
Figure 5.
Inter-omics Gaussian graphical model for sCCA selected features. The edges represent partial correlations, and significant edges were selected by the graph lasso penalty. Blue/red nodes correspond to microbe/metabolite features, BMD is shown in purple, and green/red edges correspond to positive/negative partial correlations. The edge width indicates the strength of association.

