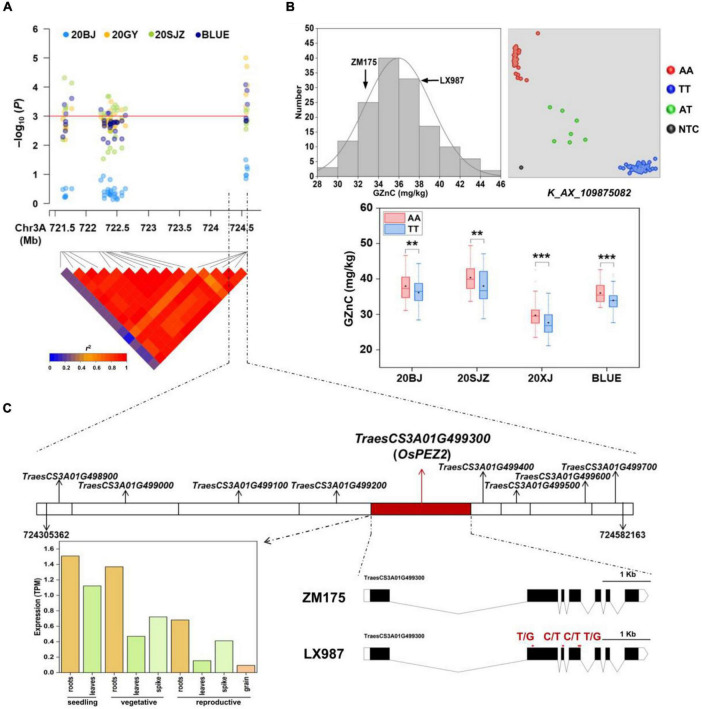
FIGURE 2.
(A) Local Manhattan plot and linkage disequilibrium (LD) heatmap of single nucleotide polymorphisms (SNPs) within the 3AL quantitative trait loci (QTL) identified for grain zinc concentration (GZnC). 20BJ, 20GY, and 20SJZ: Beijing, Gaoyi, and Shijiazhuang locations, respectively, 2019–2020. BLUE: best linear unbiased estimations. (B) The validation of 3AL QTL in ZM175/LX987 RIL population. Histograms for GZnC in the population using BLUE values across three environments (top and left); genotype calling result of the kompetitive allele-specific PCR (KASP) markers for K_AX_109875082 in the population (top and right); allelic effects of K_AX_109875082 on GZnC in the population across 20BJ, 20SJZ, 20XJ, and BLUE (bottom). AA and TT indicate two homozygous genotypes for this marker from LX987 and ZM175, respectively. AT indicates the heterozygous genotype, and NTC represents no template control. 20XJ: Xinjiang location in during 2019–2020. The black diamond in each box indicates the mean. *p < 0.05; **p < 0.01; ***p < 0.001; ns: not significant. (C) The nine annotated genes identified close to AX_109875082 with the highest p in the 3AL QTL region (top); the spatio-temporal expression profiles of the candidate gene TraesCS3A01G499300 (bottom and left); the gene structure of TraesCS3A01G499300 containing four exons with missense variants between ZM175 and LX987 (bottom and right), and red arrows indicate the positions of the exon missense variants between ZM175 and LX987.

