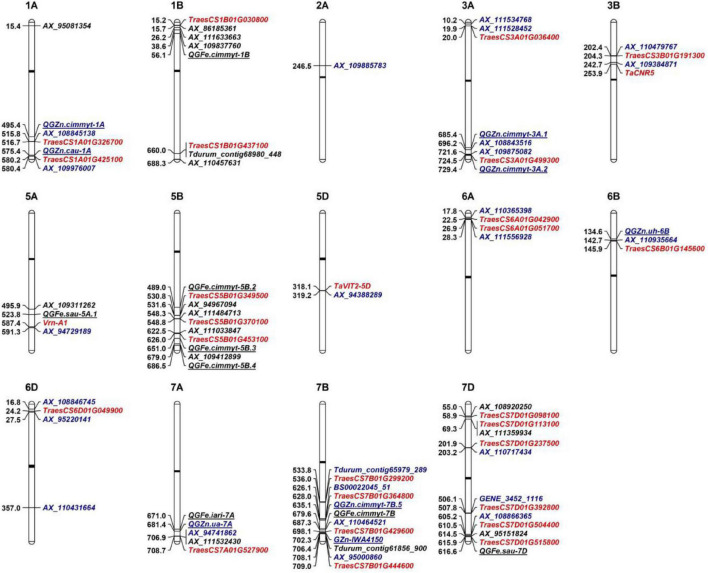
FIGURE 3.
Genetic architectures of grain zinc and iron in wheat. The top of each graph indicates the chromosome number in wheat and the left shows the physical positions based on IWGSC RefSeq v.1.0. The loci identified to associate with GZnC and GFeC are shown with black and blue fonts, respectively. The representative markers (noted in Table 2) identified in this study were used to be compared with previous reported QTL that are underlined. The closest linked markers or mid-points of previous reported QTL intervals were from Tong et al. (2020). Promising candidate genes are highlighted as red color. Black bars indicate the locations of centromeres.

