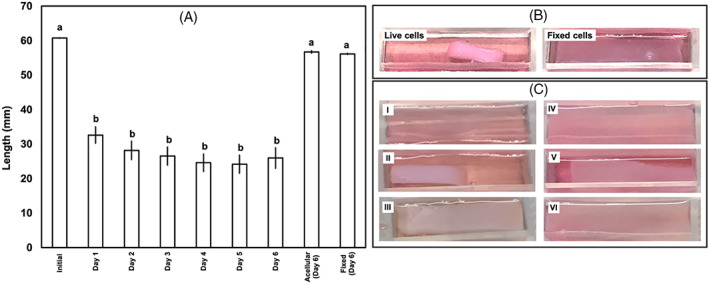
FIGURE 3.

(A) Induced contraction on collagen matrices by AF cells over 6 days postculture. Initial calculated thickness = 3.94 cm, collagen concentration = 3 mg/ml. Length was measured by imaging the samples and measuring the length using ImageJ. n = 3 for each of Day 1–6 measurements. One measurement was made for the acellular collagen sample at Day 6 and one measurement for the sample with fixed cells at Day 6. Bars with different letters are significantly different (p < 0.05; Cohen's d > 9.5 for all comparisons). Error bars indicate standard error. (B) Representative images of cells+collagen constructs for both live and fixed cells. Images are taken 48 h postculture. Constructs with cultured fixed cells show no contraction whereas live cells in collagen show significant contraction. (C) Representative images of cells+collagen constructs with varying thickness: (I) acellular collagen; (II) 3.94 cm (4 ml collagen solution); (III) 4.92 cm (5 ml collagen solution) – culture period = 24 h; (IV) acellular collagen; (V) 5.91 cm (6 ml collagen solution); (VI) 7.88 cm (8 ml collagen solution) culture period = 48 h. Increasing thickness of the collagen matrix decreases the amount of contraction induced by AF cells
