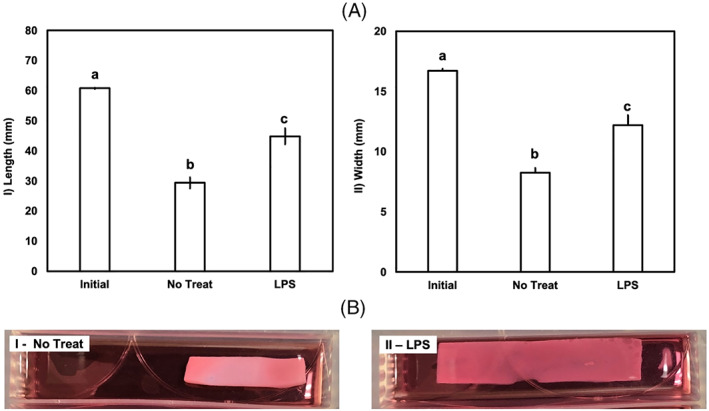
FIGURE 5.

The effect of LPS on the cells+collagen construct model. Panel (A): (I) length and (II) width are reported for n = 3. Initial, initial dimensions; LPS, LPS treated; No Treat, no treatment. Bars with different letters are significantly different (p < 0.05; Cohen's d > 3.1 for all comparisons). Cells+collagen constructs treated with LPS show noticeably less contraction. Error bars indicate standard error. Panel B shows representative images of cells+collagen. Differences in contraction induced by AF cells can also be seen in the images of the constructs
