
FIGURE 6.
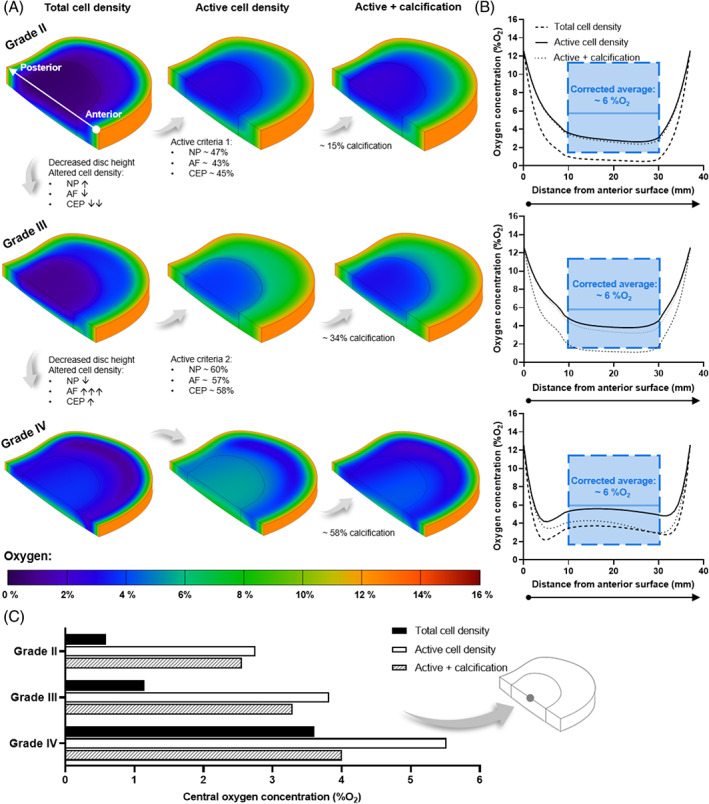
(A) Predicted oxygen contour plots within a healthy adult (Grade II), mildly (Grade III), and moderately (Grade IV) degenerated in silico intervertebral disc model. Each degeneration grade was investigated for a total cell density, a metabolically active cell density, and the effect of cartilage endplate (CEP) calcification in the active model. Cell density was altered for degeneration grades, as highlighted for each tissue domain: ↑↓ ↑ and ↓ indicates <30% increase and decrease, respectively; ↓↓ = ~60% decrease; and ↑↑↑ = ~180% increase. (B) Predicted oxygen profile at mid‐height through each of the corresponding in silico models, from the anterior surface to the posterior surface. The range of boundary corrected oxygen measurements within the nucleus pulposus (NP) and average central concentration are overlaid in blue. 66 (C) Predicted central oxygen concentration for all three degeneration grades under each of the investigated conditions