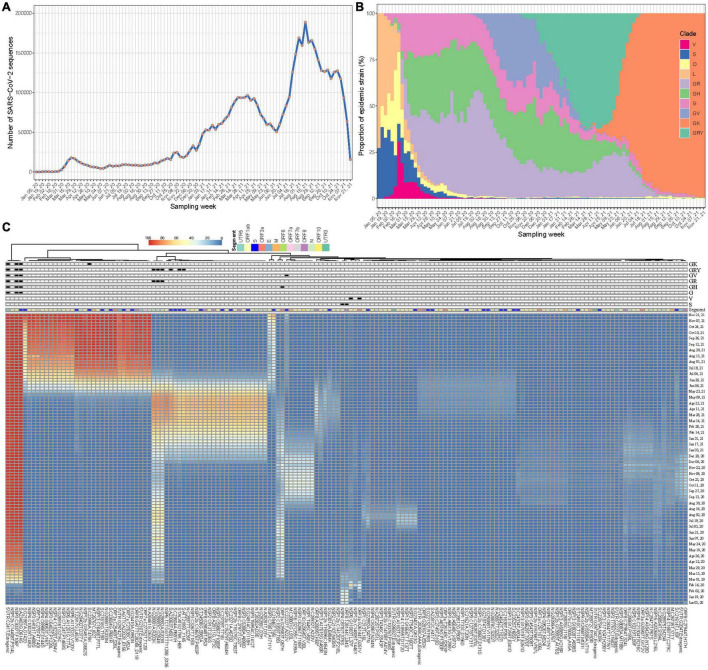
FIGURE 2.
Synchronous temporal changes between variant-specific FTMs and variant prevalence. (A) Weekly distribution of SARS-CoV-2 genome sequences according to sampling time. (B) Time course of major variant distribution in collected sequences. (C) A Wald’s linkage hierarchical cluster tree of frequency trajectories of mutations. One hundred and fifty-eight mutations passing filtration were analyzed, annotated and displayed. Variant-specific mutations were flagged.

