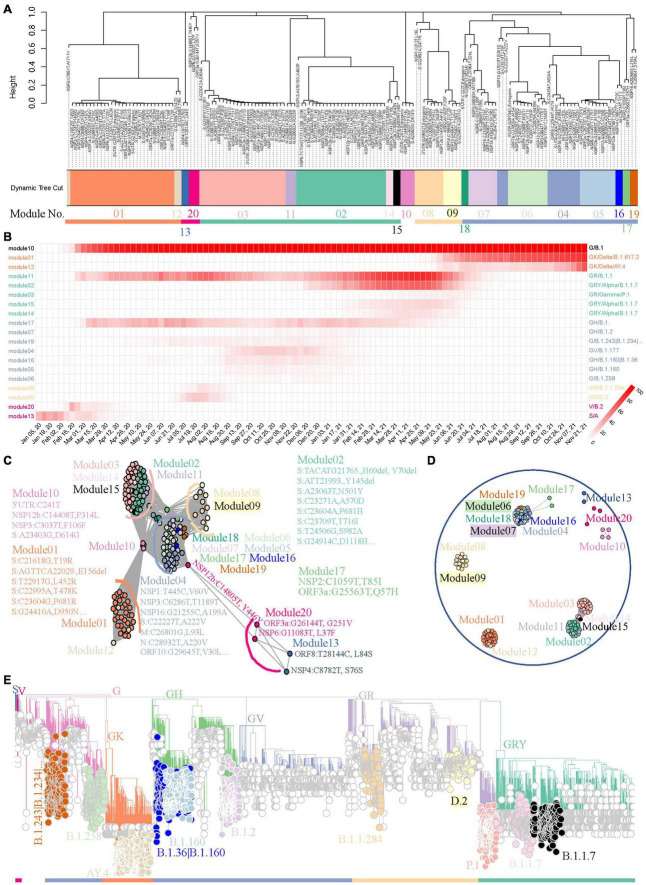
FIGURE 3.
A benchmark to use weighted network framework for identification of worldwide pandemic variants. (A) Clustering dendrogram of 158 FTMs from GISAID worldwide data. The module numbers are labeled and module clusters are highlighted with different colors. (B) The heatmap of module-based variant prevalence. The variants were determined by core mutations within each module. The modules were reordered and colored according to their module clusters and time course. (C) Network graph with topology overlap values > 10– 3 to show the relationship between nodes and modules of the weighted network. (D) Network graph with topology overlap values > 0.1. (E) Phylogenic evaluation of detected worldwide pandemic variants. Time-resolved maximum clade credibility phylogeny is shown and identified variants are highlighted and annotated with visually friendly colors.

