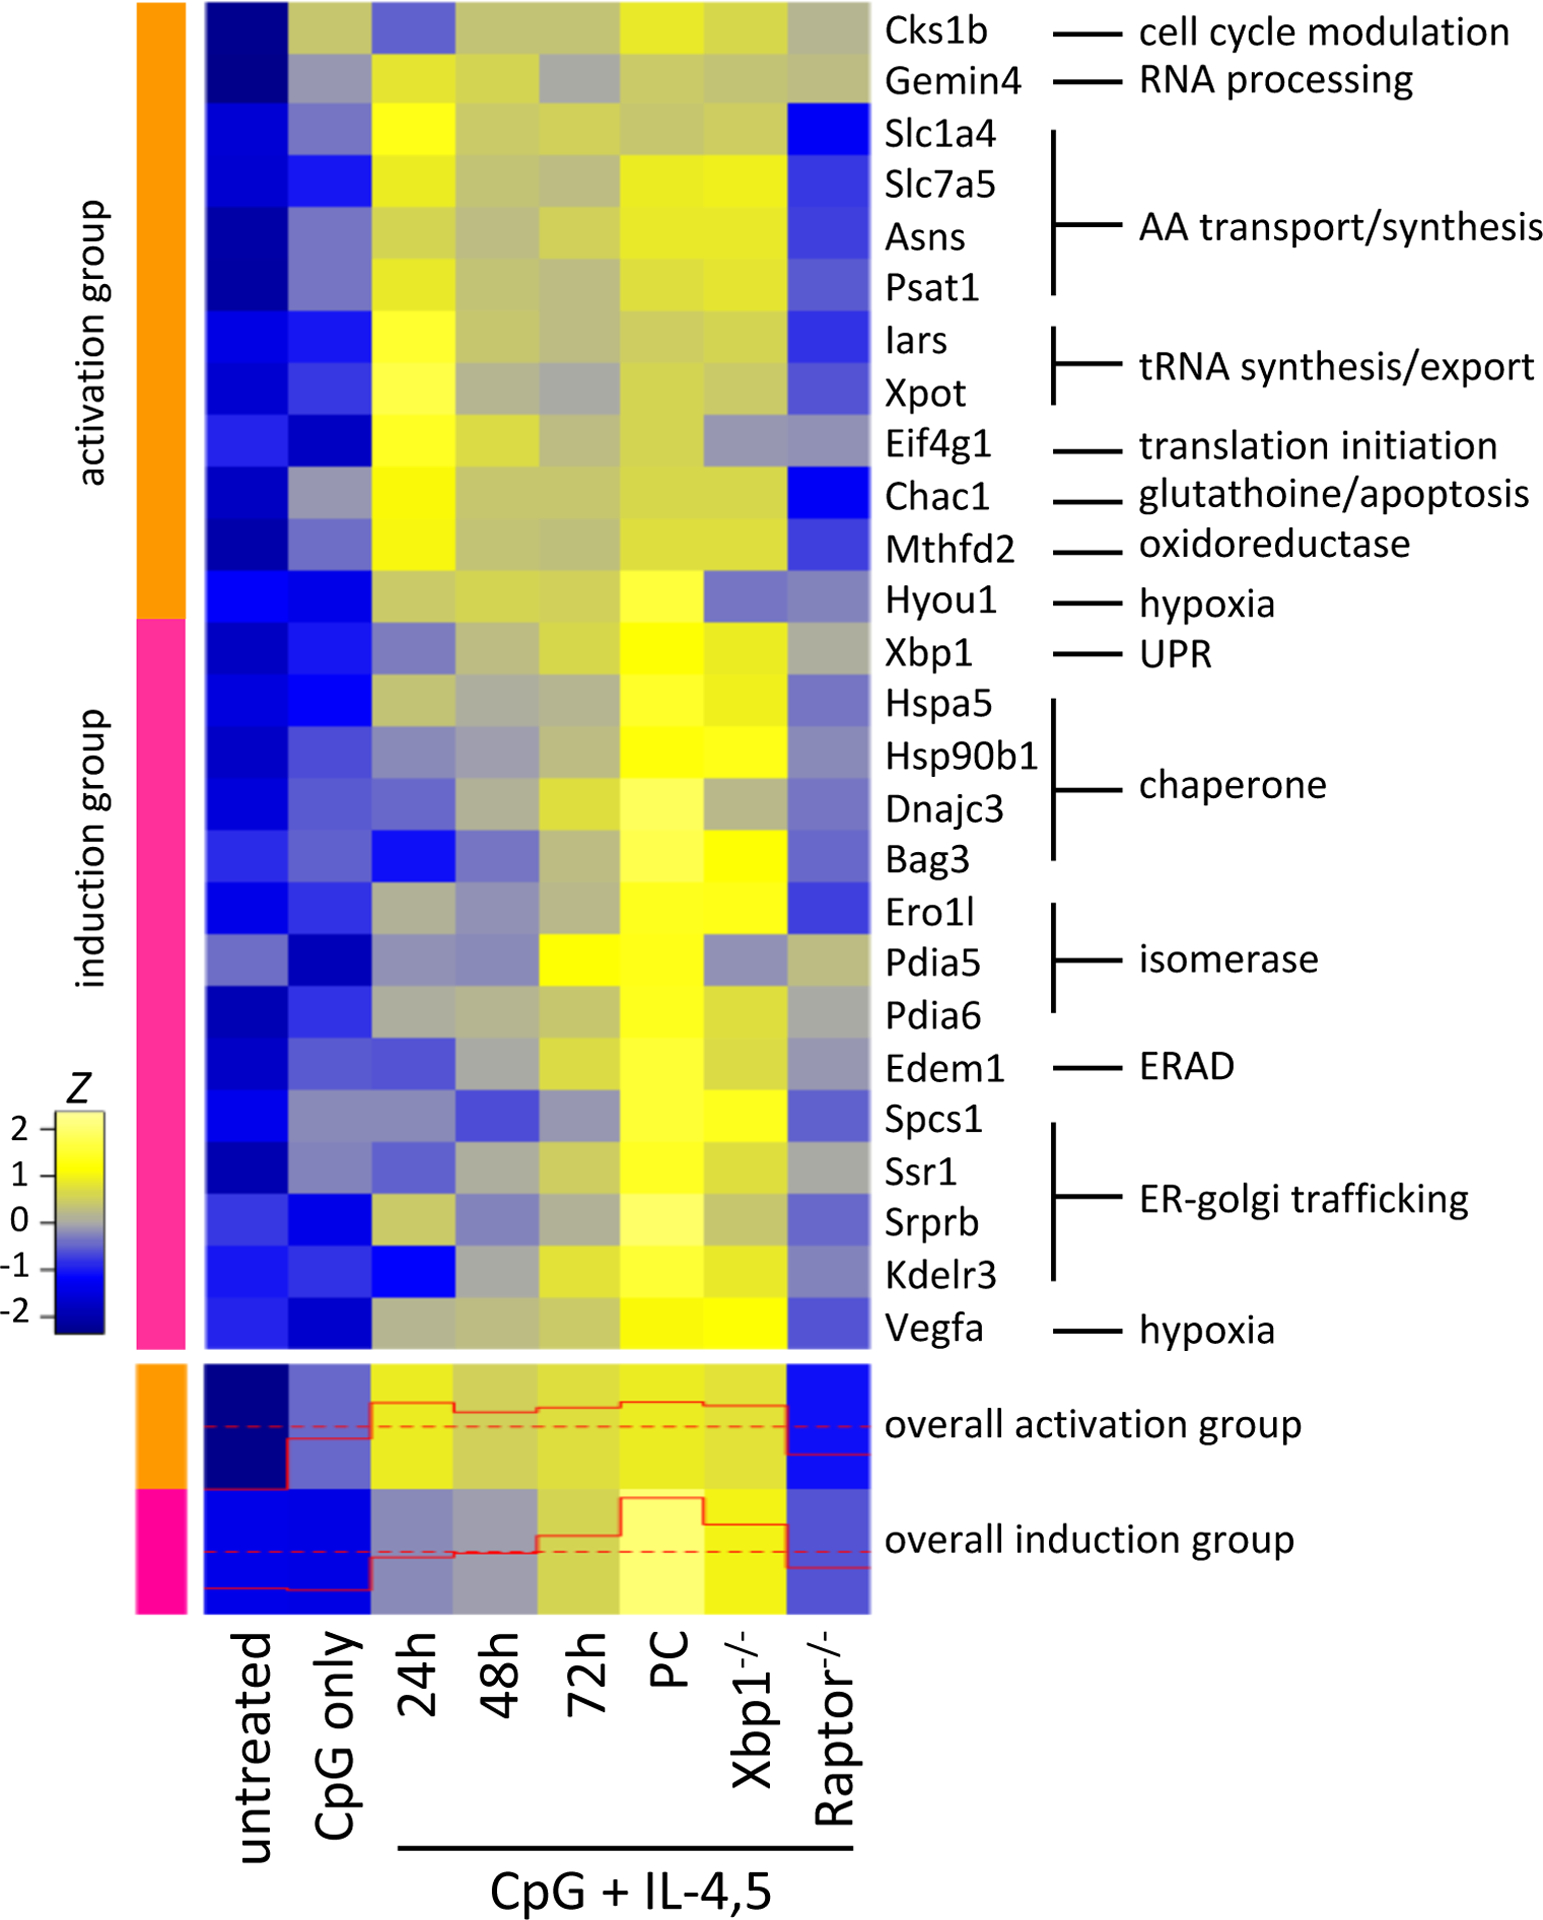
Figure 3. Gene expression data for early plasma cell UPR-associated gene expression.

(top panel) Selected genes from activation associated UPR hallmark genes (orange) and plasma cell associated UPR hallmark genes (magenta) are displayed as the z score across each row. 3–5 individual mice are averaged for each group shown. In all groups, follicular B cells were sorted from either Cre expressing control mice or mice with the indicated genes floxed out. General gene functional categories are indicated at right. (bottom panel) Gene expression for all genes included in the activation and plasma cell induction UPR genesets are summarized for the general trend of expression with the levels illustrated in the red trace. From31.
