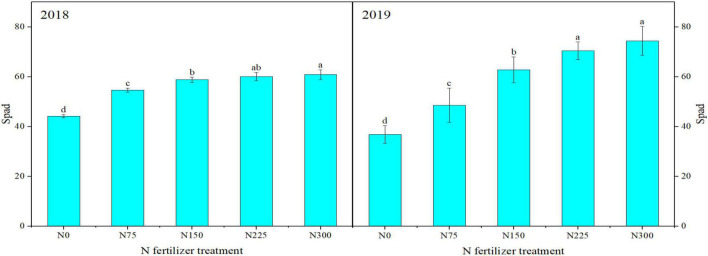
FIGURE 4.
Influence of different nitrogen (N) application rates on SPAD values at flowering stage in winter wheat during 2018 and 2019. Above bars, different small letters show significant differences among N treatments. N0: unfertilized control; N75: N application at 75 kg N⋅ha– 1; N150: N application at 150 kg N⋅ha– 1; N225: N application at 225 kg N⋅ha– 1; N300: traditional N application rate of 300 kg N⋅ha– 1.

