
Figure 6.
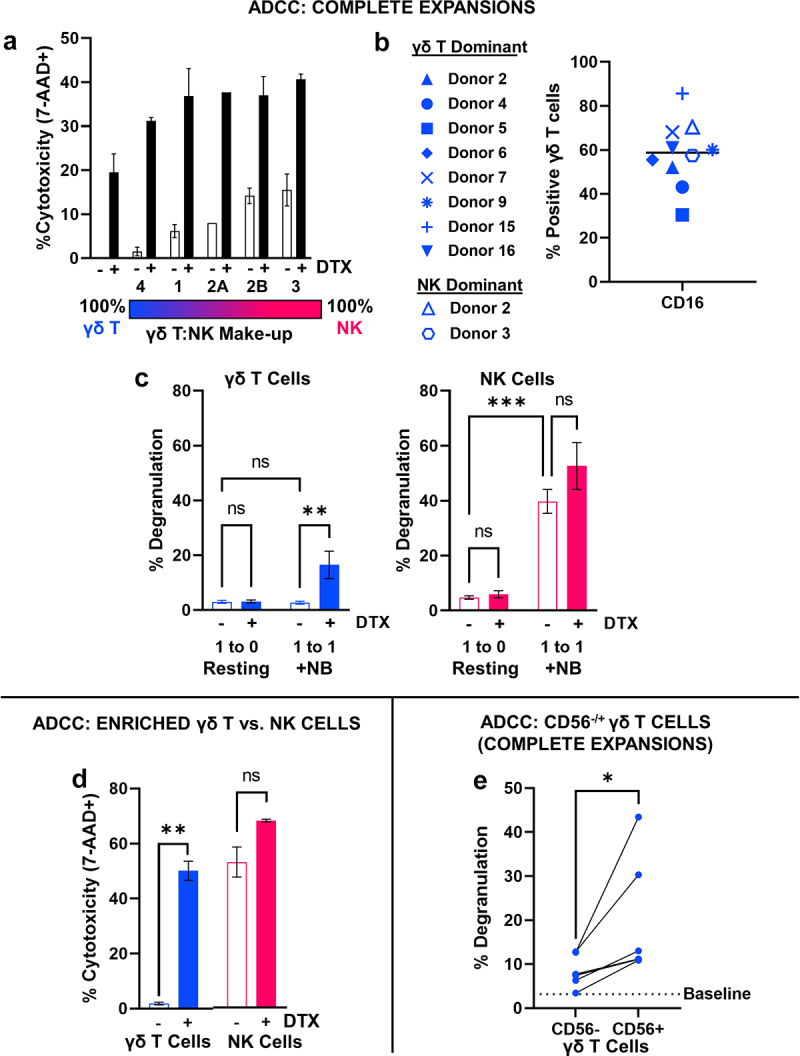
Combination with dinutuximab promotes in vitro anti-neuroblastoma activity of γδ T cells. A, Effector-induced cell death (percent 7-AAD+) of IMR5 cells following a 4-hour cytotoxicity assay with γδ T cell expansions defined by varying NK cell content in the absence (open) and presence (closed) of dinutuximab, 5 μg/mL. Data represent mean ± SD of n = 5 independent expansions from 4 different healthy donors. Donor 2 provides comparison of same donor but low vs. high NK content post-expansion. B, CD16 (FCγIII) expression on γδ T cells following 12 days of expansion. γδ T cells within NK cell dominant expansions are characterized by an open symbol. Donor symbols are provided so marker expression can be compared between donors. C, Degranulation of γδ T cells (left, blue) or NK cells (right, magenta) within complete expansions following co-culture with IMR5 cells at 1:1 effector:target ratio for 4 hours in the absence (open) and presence (closed) of dinutuximab, 5 μg/mL. Data represent mean ± SD of n = 5 independent expansions/donors; **, p = .0063, ***, p = .0003, ns, p = .3701. D, Effector-induced cell death of IMR5 cells represented by 7-AAD positivity following a 4-hour cytotoxicity assay with either γδ T cells (CD56−) or NK cells isolated from a complete day 12 expansion. Data represent mean ± SD from n = 2 independent expansion depletions; **, p = .003, ns, p = .060. E, Degranulation of CD56− or CD56+ γδ T cells within same expansion following co-culture with IMR5 cells at 1:1 effector:target ratio for 4 hours in the presence of dinutuximab, 5 μg/mL. A baseline average for resting CD107a expression in γδ T cells incubated with dinutuximab but absent of target neuroblastoma cells is provided for reference. Data represent mean ± SD of n = 5 independent expansions/donors. Cells from the same expansion are connected by line for direct comparison; *, p = .0453.