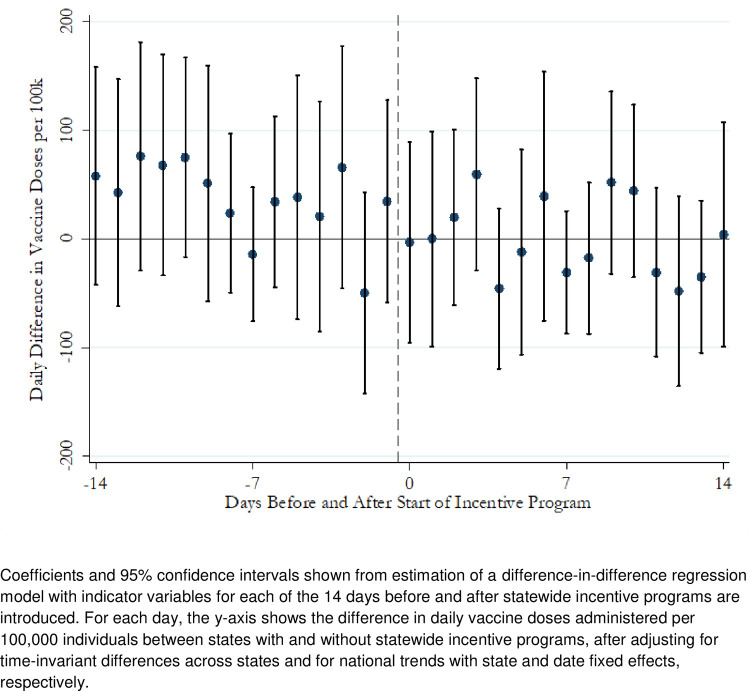
Fig 1. Difference-in-differences analysis of daily vaccination rates in states with and without incentive programs, 14 days before and after start of incentive programs.
Coefficients and 95% confidence intervals shown from estimation of a difference-in-difference regression model with indicator variables for each of the 14 days before and after statewide incentive programs are introduced. For each day, the y-axis shows the difference in daily vaccine doses administered per 100,000 individuals between states with and without statewide incentive programs, after adjusting for time-invariant differences across states and for national trends with state and date fixed effects, respectively.

