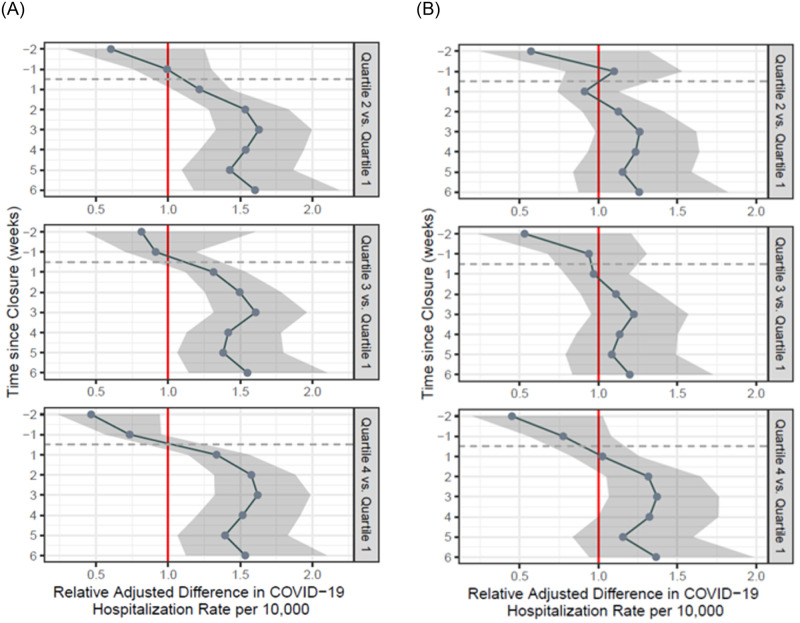
Fig 3.
A. Adjusted difference-in-difference estimates of the association between school closure and COVID-19 hospitalization rates for all age groups, with ZCTAs grouped by quartiles of multigenerational housing proportions (with quartile 1 as reference). In all panels, the vertical axis represents the number of weeks relative to the school closure order, starting two weeks before the order and going up to six weeks afterwards. These estimates are adjusted for the following ZCTA-level covariates: percentage of overcrowded households, percentage of White residents, percentage of residents living under the Federal Poverty Line, and median income in 2018 USD–all taken from the American Community Survey 2018 5-year estimates. B. Patients over 55 years of age, with population estimates adjusted for pandemic-related flight. ZCTA-level population shifts were calculated from census tract estimates of population shifts given by publicly available cellular device data from Teralytics between January 1, 2020 and April 15, 2020, obtained from the New York Times.

