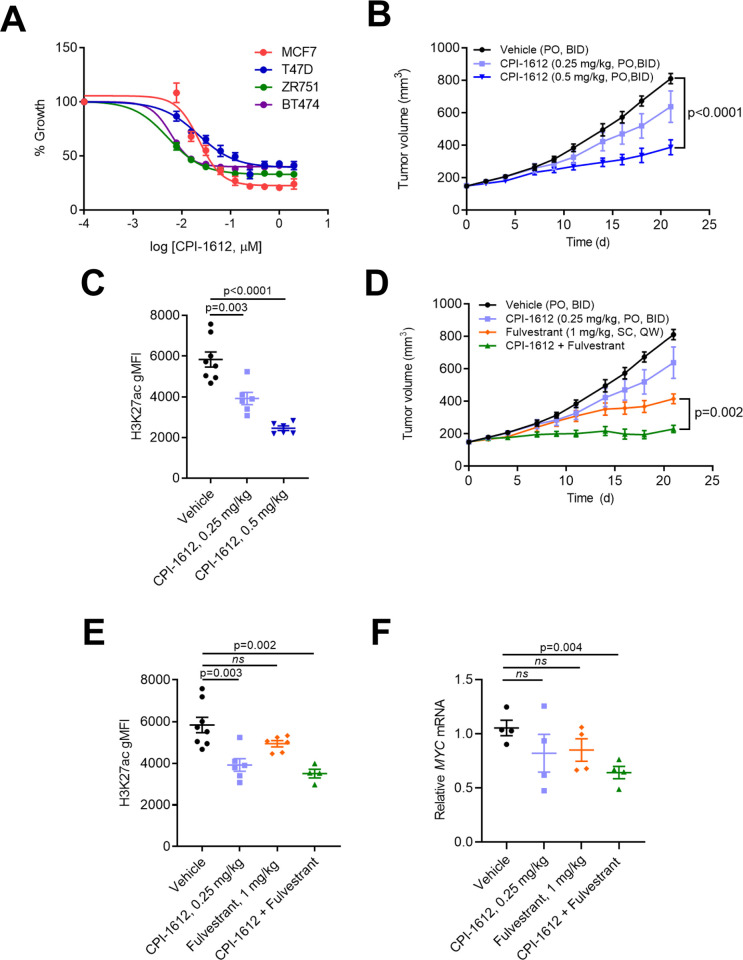
Fig 1. CPI-1612 inhibits viability of ER+ breast cancer cell lines and ER signaling both in vitro and in vivo.
(A) In vitro activity of CPI-1612. ER+ breast cancer cell lines were treated with increasing doses of CPI-1612 and cell viability was measured using Cell Titer Glo after 4 days of treatment. Error bars represent standard deviation (n = 2). (B) In vivo activity of single agent CPI-1612. Female Balb/c nude mice were implanted subcutaneously with MCF7 cells (n = 8 for vehicle, n = 6 for others) and treated with the indicated doses of CPI-1612 (PO, BID) or an equal volume of vehicle (PO, BID). Tumor volumes were measured by caliper until study termination at 21 days. Data points represent mean and SEM at each timepoint. P-values were calculated using an unpaired student’s t-test relative to the vehicle arm; the p-value at study endpoint is shown (no data point in the 0.25 mg/kg arm reached statistical significance). (C) Pharmacodynamic readout of CPI-1612 activity. PBMCs were isolated from blood at study termination, fixed, and stained for FACS analysis. The level of H3K27ac was quantified using gMFI (geometric mean fluorescence intensity). Data are represented as mean ± SEM, and p-values were calculated using an unpaired student’s t-test. (D) Efficacy of CPI-1612 in combination with Fulvestrant. Mice were xenografted with MCF7 cells as in (B) and treated with CPI-1612 (0.25 mg/kg, PO, BID), Fulvestrant (1 mg/kg, SC, QW), CPI-1612 + Fulvestrant, or vehicle (n = 8 for vehicle, n = 6 for others). Data points represent the mean and SEM of surviving animals, and p-values were calculated at each timepoint using an unpaired student’s t-test. P-value for the difference between Fulvestrant and CPI-1612 + Fulvestrant at study endpoint is shown. (E) PD in PBMCs for study described in (D), as in (D). (F) Tumor PD as measured by gene expression changes. Total mRNA was isolated from tumors collected at study endpoint and used for q-RTPCR analysis. MYC expression normalized to ACTB was calculated relative to vehicle mean and is expressed as mean ± SEM for each arm. P-values were calculated by unpaired student’s t-test relative to vehicle.

