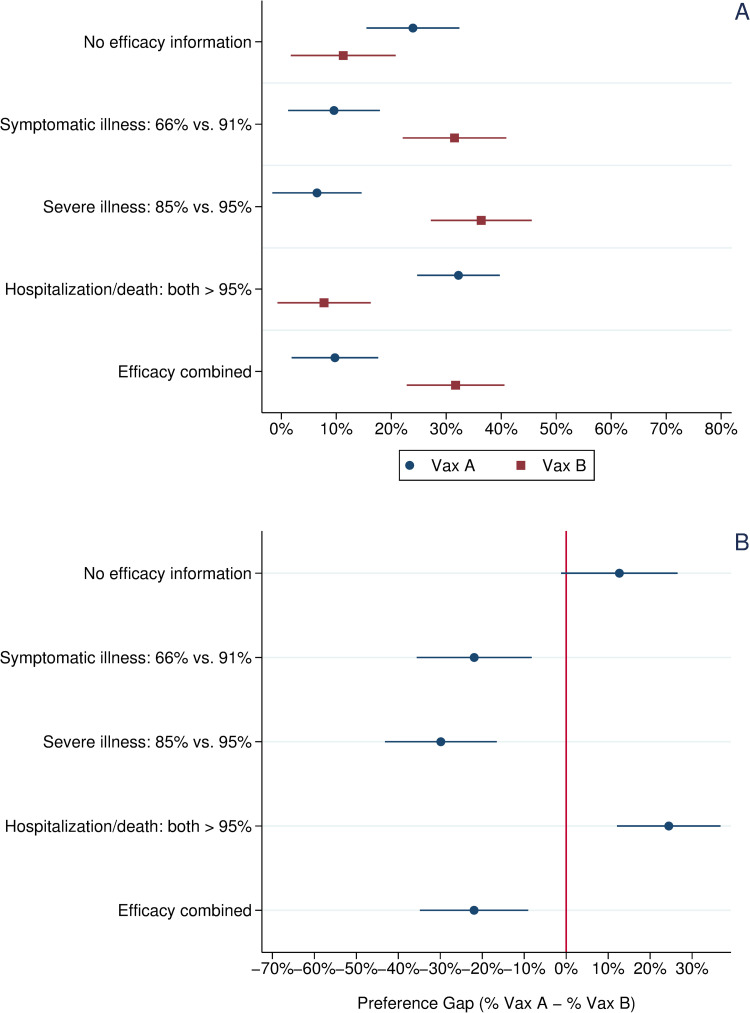
Fig 2. Vaccine choice and preference gap across experimental treatments, unvaccinated respondents.
Note: Panel A: Circles indicate the percentage choosing Vaccine A, a one-shot, viral vector vaccine with efficacy data mirroring that reported in the Janssen vaccine trials. Squares indicate the percentage choosing Vaccine B, a two-shot, mRNA vaccine with efficacy data mirroring that reported in the Pfizer vaccine trials. Panel B: Circles indicate the preference gap between Vaccine A and Vaccine B. Horizontal bars present 95% confidence intervals about each mean value.

