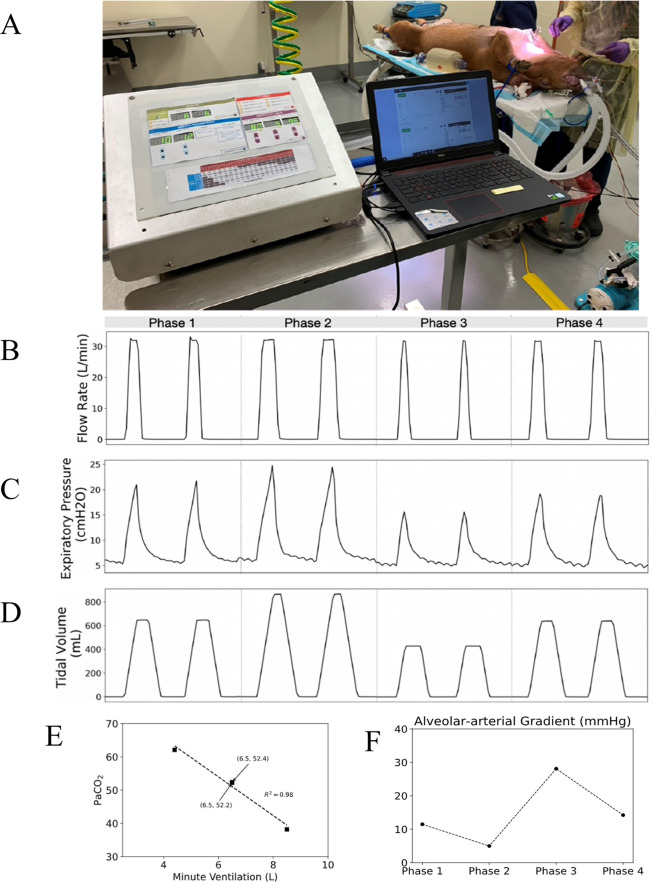
Fig 3. Ventilator and physiology results from the animal test.
(A) The O2U ventilator performing mandatory ventilation on a sedated and intubated porcine subject. (B) Flow rate recordings during the different phases of the animal test, while the incoming flow rate, set on the flowmeter, was maintained at 33 L/min with each phase the inspiration time was changed to change the tidal volume, changing the width of the flow peaks. (C) The PEEP was maintained constant at 5 cmH2O during the test though the peak expiratory pressure measurements changed according to the current simulated ventilation treatment phase. (D) The tidal volume was the key controlled variable in the animal test with each phase targeting values to correspond to different desired physiological responses, these responses were measured in Table 3. (E) The relationship between the Minute Ventilation and the PaCO2 showing the linear inverse relationship. (F) The A-a gradient during the different phases of the experiment.

