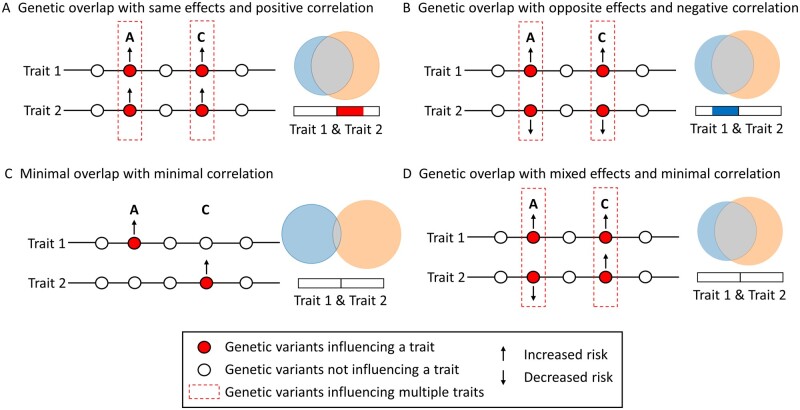
Figure 1.
Conceptual figure illustrating MiXeR’s ability to characterise genetic overlap beyond genetic correlation adapted from Smeland et al.26 Four scenarios of genetic overlap (A–D) with corresponding MiXeR Venn diagrams and genetic correlations. Genetic overlap with a preponderance of shared variants with the same (A) or opposite (B) effect directions results in either positive (A, red bar) or negative (B, blue bar) genetic correlation. However, since genetic correlation provides an estimate of the correlation of effect sizes between two traits, it is unable to discriminate between scenarios C and D, both of which return minimal genetic correlations. In contrast, since MiXeR estimates the number of shared variants regardless of effect direction, MiXeR successfully estimates more extensive genetic overlap in D compared to C, represented by the larger shared component (grey).

