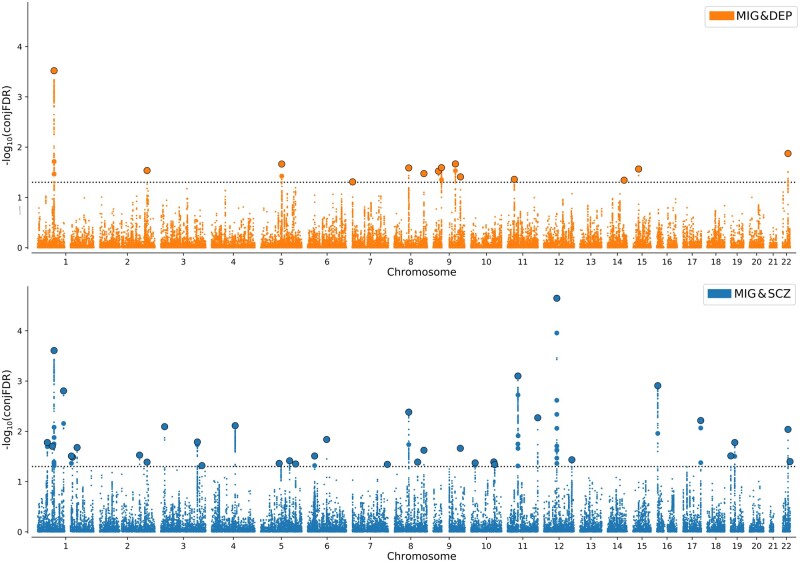
Figure 3.
Chromosomal distribution of genetic loci jointly associated with migraine and mental disorders. Manhattan plots showing the −log10 transformed conjunctional FDR values for (A) depression (DEP) and migraine (MIG) (orange) and (B) schizophrenia (SCZ) and migraine (blue) for each SNP (y-axis) against chromosomal position (x-axis). The dotted line represents the conjFDR threshold for significant association <0.05. Black outlined circles represent independent lead SNPs.

