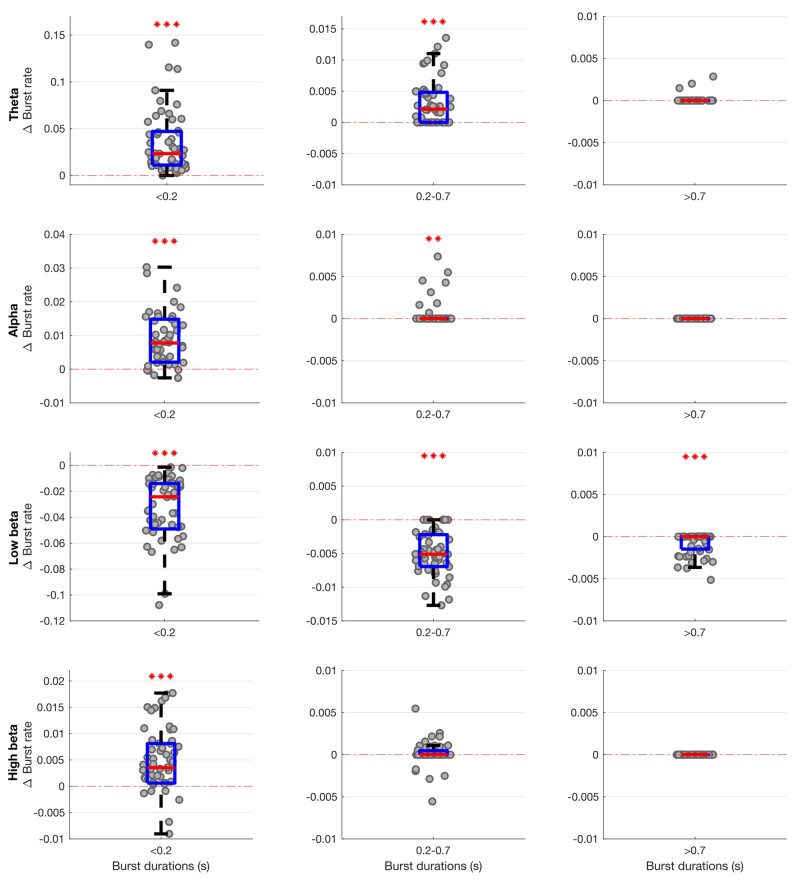
Figure 2.
Box-and-whisker plots of change (ON–OFF) in the rate of theta (4–7 Hz), alpha (8–12 Hz), low beta (13–21 Hz) and high beta (22–35 Hz) states identified by the combination of different HMM models. There are widespread changes in the burst rate of states between the OFF and ON medication condition, with these most marked for theta and low beta states. Each dot represents the median value across the 64 hemispheres in one HMM model (data from 56 different models are plotted). Statistics were derived after performing permutation testing and thereafter corrected for multiple comparisons using the FDR method. Data are presented in the form of modified box-and-whisker plots with a box from the first quartile to the third quartile, a vertical line drawn through the box at the median and whiskers drawn up to the upper and lower extreme values (excluding outliers). *P < 0.05, **P < 0.01, ***P < 0.001.

