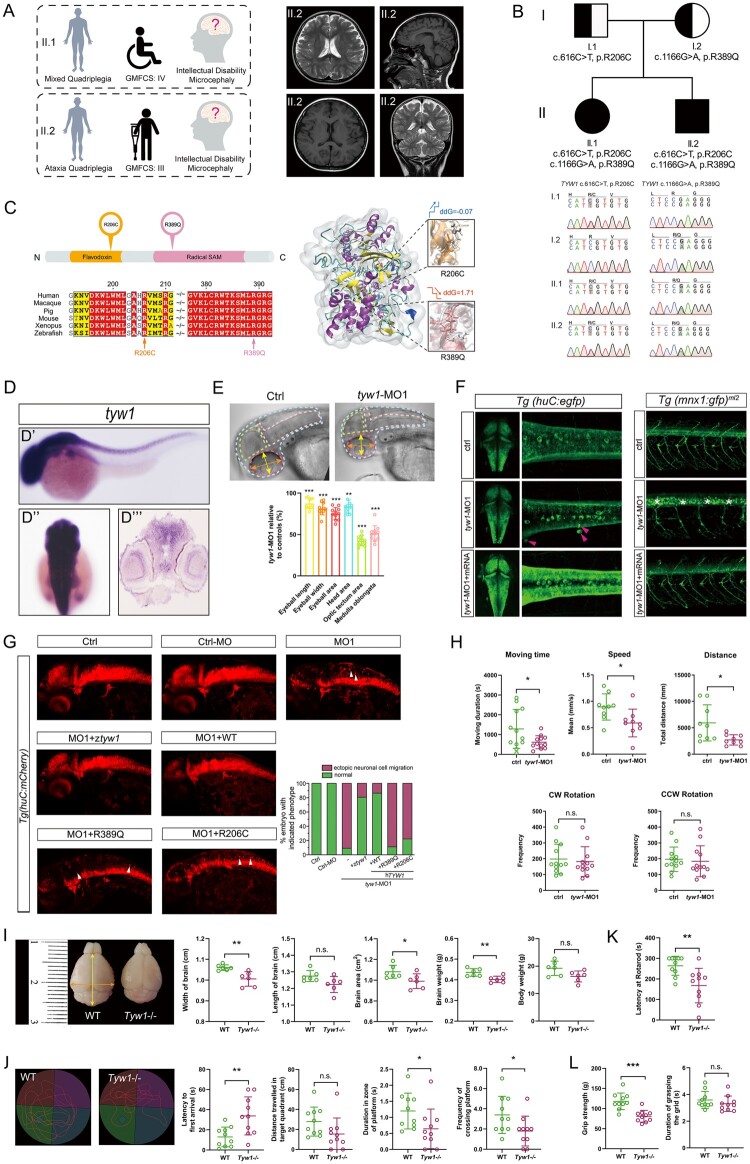
Figure 3.
Correlation between the phenotype and genotype of TYW1. (A) Clinical summary of the two index patients harbouring TYW1 variants, and the cranial MRI of the patient II.2 (CP_012_1). (B) Compound heterozygous variants of TYW1 were identified in the two index patients, which cosegregated with the phenotype in the family members. (C) The two identified amino-acid changes (i.e. R206C and R389Q) were located inside the protein domains of flavodoxin and radical SAM, respectively. The two changes took over the highly conserved amnio-acid positions throughout a series of species. A three-dimensional structural model of TYW1 protein displayed the stability alterations (ddG, Gibbs free energy) and local structural changes, before and after the introduction of two amino-acid changes. In the two zoomed-in views, the white bars denote wild-type amino acids and the colour bars denote mutated amino acids. (D–H) Morphological and behavioural assays in zebrafish models. (D) WISH of zebrafish embryos at 36 hours postfertilization (hpf) using a zebrafish antisense probe of tyw1 showing specific expression of tyw1 in the central nervous system, including the brain and spinal cord. D’: lateral view. D’’: dorsal view. D’’’: cross section. hpf: hours postfertilization. (E) Head area, optic tectum area, medulla oblongata area, eyeball area, eyeball length and eyeball width of the tyw1 knockdown (tyw1-MO1, a splice-blocking morpholino) zebrafish larvae at 5 dpf were significantly decreased compared with those of the controls. n = 10 for each test group. ** P < 0.01, *** P < 0.001, unpaired t-test. dpf: days postfertilization. (F) Confocal imaging of egfp positive cells in transgenic zebrafish Tg(huC: egfp) embryos at 48 hpf showing ectopic neuronal cells Figure 3: Continued (indicated by red arrowheads) in the tyw1-MO1 zebrafish group, which could be rescued by the wild-type tyw1 mRNA. Confocal imaging of gfp positive cells in the transgenic zebrafish Tg(mnx1: gfp)ml2 embryos at 72 hpf showed undifferentiated motor neuronal cells (indicated by white stars) in the tyw1-MO1 zebrafish group, which could be rescued by wild-type tyw1 mRNA. (G) The tyw1 knockdown (tyw1-MO1) brought about ectopic neuronal cells in the zebrafish Tg(huC: mCherry) embryos at 48 hpf, and there were only 9% of participants that remained normal. This abnormal phenotype could be rescued by zebrafish tyw1 mRNA (ztyw1), human TYW1 mRNA (WT), mutated human TYW1 leading to R389Q or mutated human TYW1 leading to R206C, to variable extents (81, 86, 11 and 22%, respectively). Ectopic neuronal cells are indicated by white arrowheads. The number of fish used ranged from 63 to 88 in the different test groups. (H) Swimming behaviour tests of tyw1-MO1 zebrafish larvae at 5 dpf compared with the controls, in terms of moving time, speed, distance, clockwise (CW) rotation and counterclockwise (CCW) rotation. The former three parameters revealed significant reductions in the tyw1-MO1 group compared with those in the control group, while the latter two parameters showed no significant change. n = 9 to 12 for each test group. * P < 0.05, n.s. = no significant difference, unpaired t-test. (I–L) Morphological and behavioural assays on Tyw1 knockout (Tyw1−/−) mouse models. (I) The Tyw1−/− mice at postnatal 8 weeks showed significantly reduced brain size and weight compared with those of wild-type (WT) mice. The orange arrow, yellow arrow and red-dashed lines indicate the width, length and area of brain, respectively. In parallel, measurements of body weight revealed no significant difference between the Tyw1−/− mice and the WT mice. N = 6 per genotype with equal numbers of male and female mice. * P < 0.05, ** P < 0.01, n.s.: no significant difference, unpaired t-test. (J) Track plots depicting the traces of mice during the probe test in the Morris water maze. The Tyw1−/− mice showed worse performance compared with that of WT mice in the test. n = 10 per genotype with equal numbers of male and female mice. * P < 0.05, ** P < 0.01, n.s.: no significant difference, unpaired t-test. (K) Rotarod tests showed significantly reduced motor coordination and balance of the Tyw1−/− mice compared with those of WT mice. n = 10 per genotype with equal numbers of male and female mice. ** P < 0.01, unpaired t-test. (L) Grip strength tests revealed significantly weaker grip strength of the Tyw1−/− mice compared with that of the WT mice. n = 10 per genotype with equal numbers of male and female mice. *** P < 0.001, n.s.: no significant difference, unpaired t-test.

