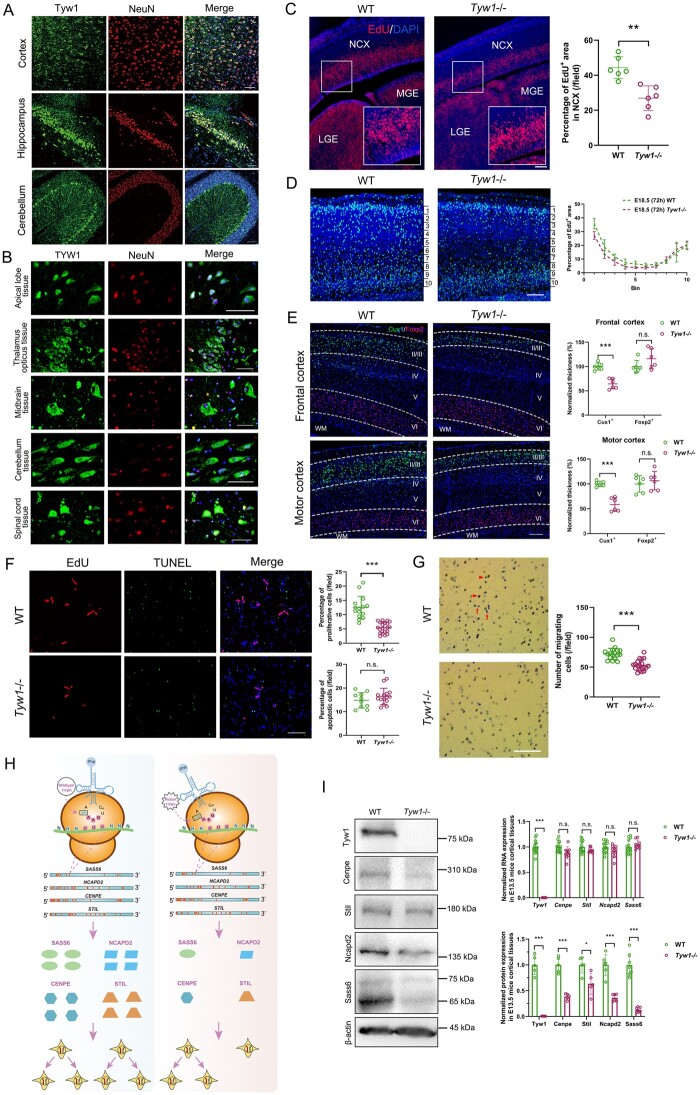
Figure 4.
Functional mechanism of defective TYW1. (A) Brain-section immunostaining of wild-type mice at postnatal 8 weeks, where Tyw1 (green) and NeuN (red) are colabelled, showing Tyw1 expression in neurons within the cortex, hippocampus and cerebellum. Blue: DAPI. Scale bar = 75 μm. (B) Immunostaining of normal human brain tissue microarrays, where TYW1 (green) and NeuN (red) are colabelled, revealing TYW1 expression in neurons within a variety of brain regions. Blue: DAPI. Scale bar = 50 μm. (C) EdU was intraperitoneally injected at 2 h into pregnant mice before euthanizing them to harvest embryos at E13.5. Cells incorporated with EdU were determined in the embryonic brain sections under fluorescent microscopy and were analysed with ImageJ software. Compared with those of WT littermates, significantly reduced percentages of EdU+ areas were observed in the neocortex (NCX) of Tyw1−/− embryonic brains, as well as in the medial ganglionic eminence (MGE) and lateral ganglionic eminence (LGE). Red: EdU. Blue: DAPI. n = 3 per genotype. For a specific sample, each measurement was performed twice in separate fields. ** P < 0.01, unpaired t-test. Scale bar = 100 μm. (D) EdU was injected into the pregnant mice carrying embryos at E15.5, which were observed after 72 h. The embryonic cortex was divided into 10 equally spaced bins along the vertical axis. The percentage of EdU+ area in each bin was measured. In Tyw1−/− mouse cortices, there were less EdU+ cells in superficial layers (layers II–III) than those in WT mice, while the number of EdU+ cells in the deep layer (layer VI) was greater than that in WT mice. Light blue: EdU. Blue: DAPI. n = 3 per genotype. Scale bar = 100 μm. (E) Brain-section immunostaining of mice at postnatal 8 weeks, where Cux1+ and Foxp2+ cells were labelled for neurons in superficial layers (layers II–III) and the deep layer (layer VI), respectively. Compared with those of WT mice, Tyw1−/− mouse brains showed a significantly reduced thickness of superficial layers at both frontal and motor cortices, while in the deep layers, the reverse phenomenon occurred, albeit without statistical significance. WM: white matter. Green: Cux1. Red: Foxp2. Blue: DAPI. n = 3 per genotype. For a specific sample, each measurement was performed twice in separate fields. *** P < 0.001, n.s.= no Figure 4: Continued significant difference, unpaired t-test. Scale bar = 200 μm. (F–G) Proliferation, apoptosis and migration analysis of primary neurons from the cortices of E13.5 mice. (F) Quantification of the proliferative and apoptotic primary neurons from E13.5 mouse brain cortices. The primary neurons from the Tyw1−/− mice showed significantly decreased proliferation (as indicated by EdU staining), while the intensity of apoptosis did not change significantly (as determined by TUNEL staining). *** P < 0.001, n.s.: no significant difference, unpaired t-test. Scale bar = 100 μm. (G) Quantification of migrating primary neurons from the E13.5 mouse brain cortex. In the transwell assay, the primary neurons from the Tyw1−/− mice showed significantly decreased migration. Red arrows indicate cells that already migrated through pores, while arrowheads indicate cells that were migrating in pores. *** P < 0.001, n.s. = no significant difference, unpaired t-test. Scale bar = 250 μm. (H) Schematics of the mechanism of ribosomal frameshift under the conditions of wild-type and mutant alleles of TYW1. GAA is the anticodon of tRNAPhe for phenylalanine, and UUU is the codon of mRNA for phenylalanine. In the four mRNAs, with normalized lengths, of SASS6, NCAPD2, CENPE and STIL, the positions of UUU codons are indicated by red bars. The introduction of mutated TYW1 led to promotion of a ribosomal frameshift at the interaction between tRNAPhe and mRNAs, resulting in the reduced production of a subset of proteins involved in cell cycling. (I) Measurements of mRNA and protein levels in the E13.5 mouse brain cortex. In the Tyw1−/− group, the mRNA levels of Cenpe, Stil, Ncapd2 and Sass6 did not change significantly compared with those in the WT group. However, the protein levels of Cenpe, Stil, Ncapd2 and Sass6 showed significant reductions compared with those in the WT group, with remaining levels of 0.38, 0.63, 0.36 and 0.14, respectively. β-actin was used as the internal control for both RNA and protein measurements. Neither RNA nor protein of Tyw1 could be detected in the Tyw1−/− group. MW (Tyw1) = 84 kDa. MW (Cenpe) =312 kDa. MW (Stil) =143 kDa. MW (Ncapd2) =157 kDa. MW (Sass6) =74 kDa and 65 kDa. MW (β-actin) = 43 kDa. Quantitative PCR with reverse transcription and western blotting data were from three independent experiments. * P < 0.05, *** P < 0.001, unpaired t-test.

