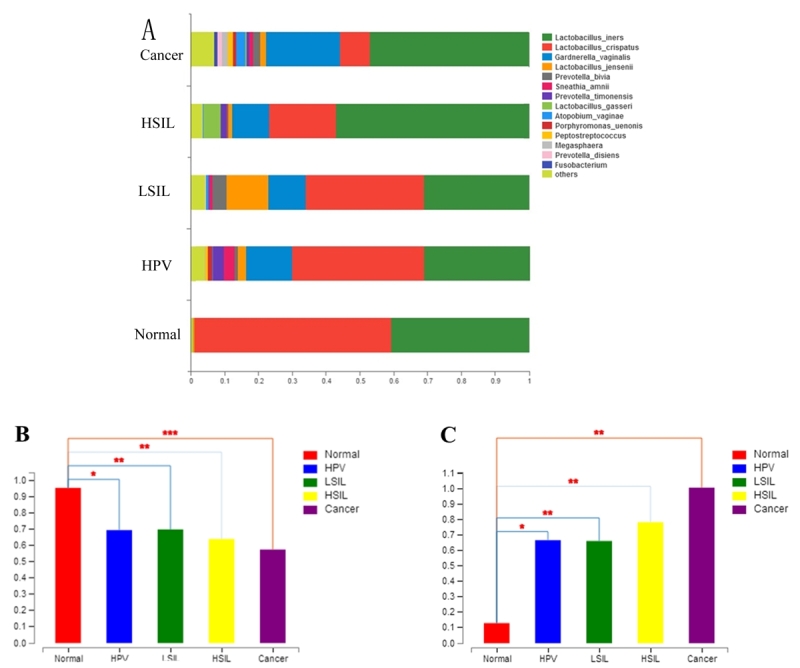
Figure 1-. The comparisons of the five groups in vaginal microbiota. (A) Bar chart describing the difference in bacterial diversity between the normal, HPV, LSIL, HSIL and cancer groups. (B) Simpson index of OTU level and P values calculated using Student`s t-test (P ≤ 0.05 was marked as *; 0.001 < P ≤ 0.01 was marked as **; P ≤ 0.001 was marked as ***). (C) Shannon index of OTU level and P values calculated using Student`s t-test (P ≤ 0.05 was marked as *; 0.001 < P ≤ 0.01 was marked as **; P ≤ 0.001 was marked as ***).