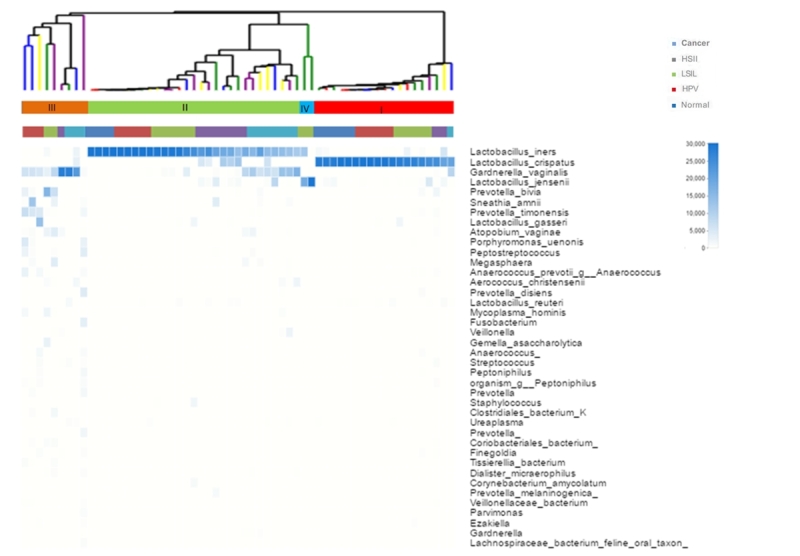
Figure 2 -. Heat map analysis, each vertical line represents a sample. Relative abundance is shown in blue and white: blue indicates a high proportion, and white indicates a low proportion. Five groups (normal, HPV, LSIL, HSIL, cancer) were distributed in different CSTs with different colors.