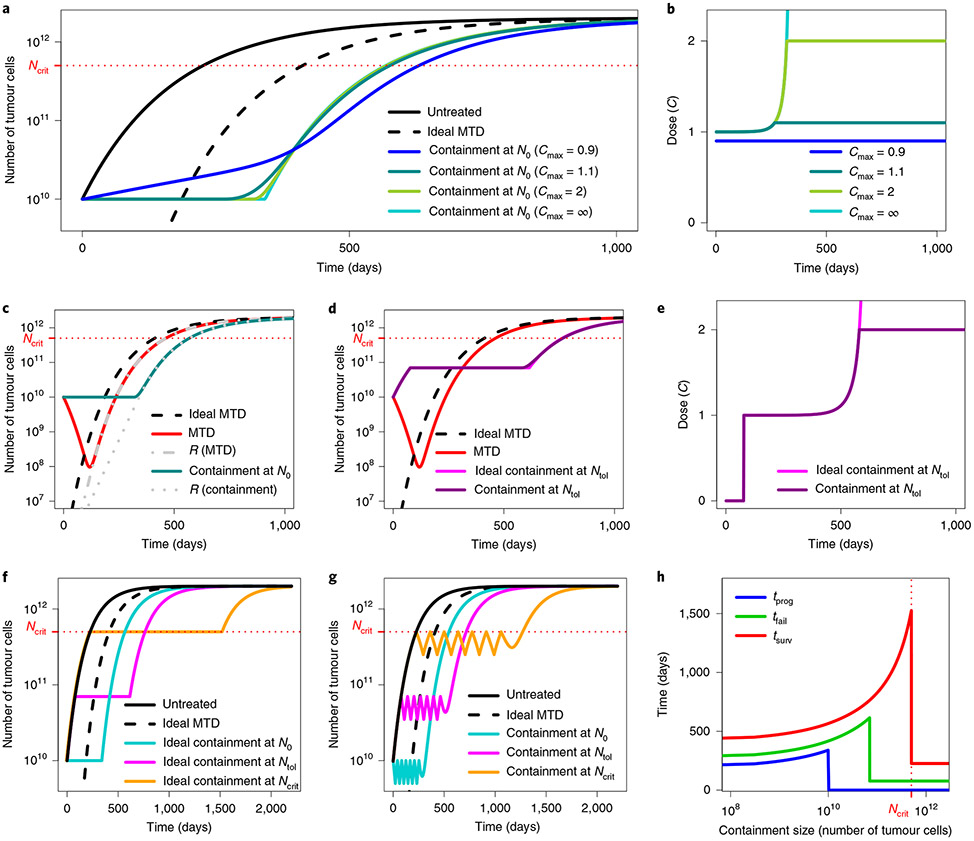
Fig. 1 ∣. Illustration of containment and MTD treatments in Model 3.
a, Tumour size under no treatment (black), ideal MTD (dashed) and containment at the initial size for various values of the maximum tolerated dose Cmax. The case Cmax = ∞ (light blue) corresponds to ideal containment. The patient is assumed to die shortly after tumour size becomes greater than Ncrit. b, Drug dose under the containment treatments of a. If Cmax < 1, the tumour cannot be stabilized and containment boils down to MTD. c, Tumour size under MTD, ideal MTD and containment at the initial size and resistant population size under MTD and containment. The effect of varying R0 is illustrated in Extended Data Fig. 3. d, Tumour size under MTD, containment at the maximum tolerable size and their idealized counterparts. The effect of varying Cmax is illustrated in Extended Data Fig. 6. e, Drug dose under containment and ideal containment at the maximum tolerable size, as represented in d. f, Tumour size under no treatment, ideal MTD and ideal containment at three different tumour sizes. g, Tumour size under no treatment, ideal MTD and intermittent containment between Nmax and Nmin = Nmax/2 for 3 different values of Nmax. h, Times to progression (blue), treatment failure (green) and survival time (red) under ideal containment at a threshold size varied from R0 to Ncrit (ideal containment at R0 is equivalent to ideal MTD). The time until the tumour exceeds a certain size is maximized by ideal containment at that size. The exact formulas for the idealized treatments are found in the Supplementary Information, section 3.

