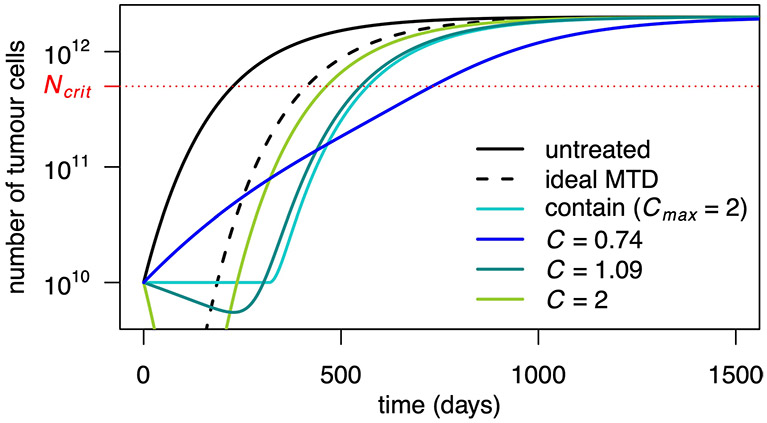
Extended Data Fig. 7 ∣. Constant dose treatments in a Gompertzian growth model (Model 3 in the main text).
Tumour size for various constant dose treatments are compared to containment at the initial size (subject to Cmax = 2), MTD (C = Cmax) and ideal MTD. Dose 1.09 maximizes time to progression and 0.74 maximizes survival time among non-delayed constant doses (but is inferior to the optimal delayed constant dose). Parameter values are as in Table 2 of the main text.

