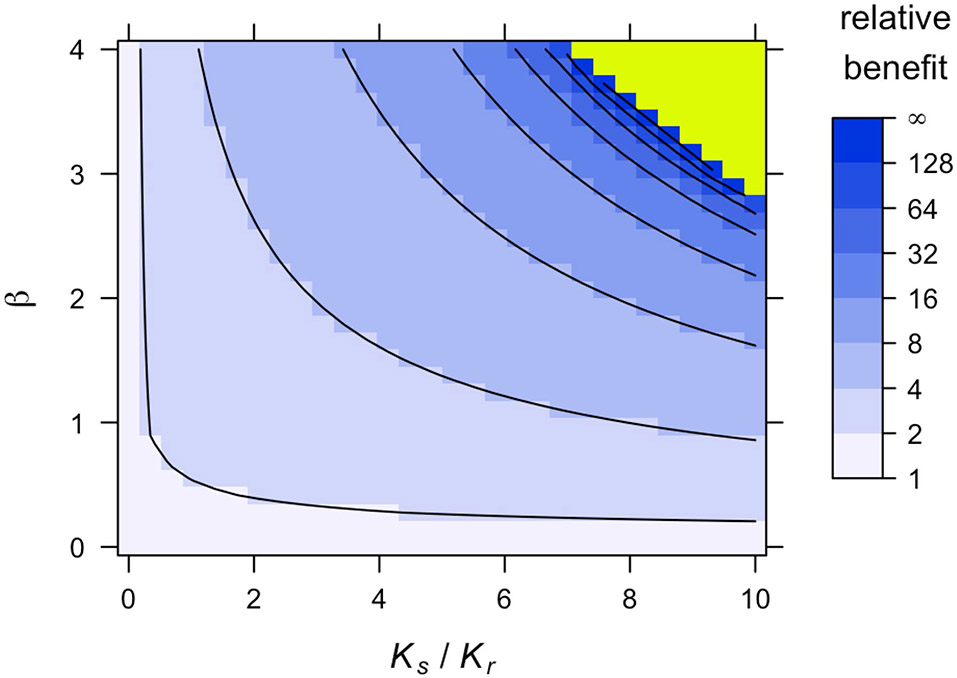
Extended Data Fig. 8 ∣. Consequences of costs of resistance in a Gompertzian growth model (Model 4 in the main text).
Relative benefit, in terms of time to treatment failure, for ideal containment (at size Ntol) versus ideal MTD, for varied values of Kr and β. The figure is obtained from simulations, while Fig. 4a in the main text is obtained from our approximate formula. Contour lines are at powers of 2. Fixed parameter values are as in Table 2 of the main text.

