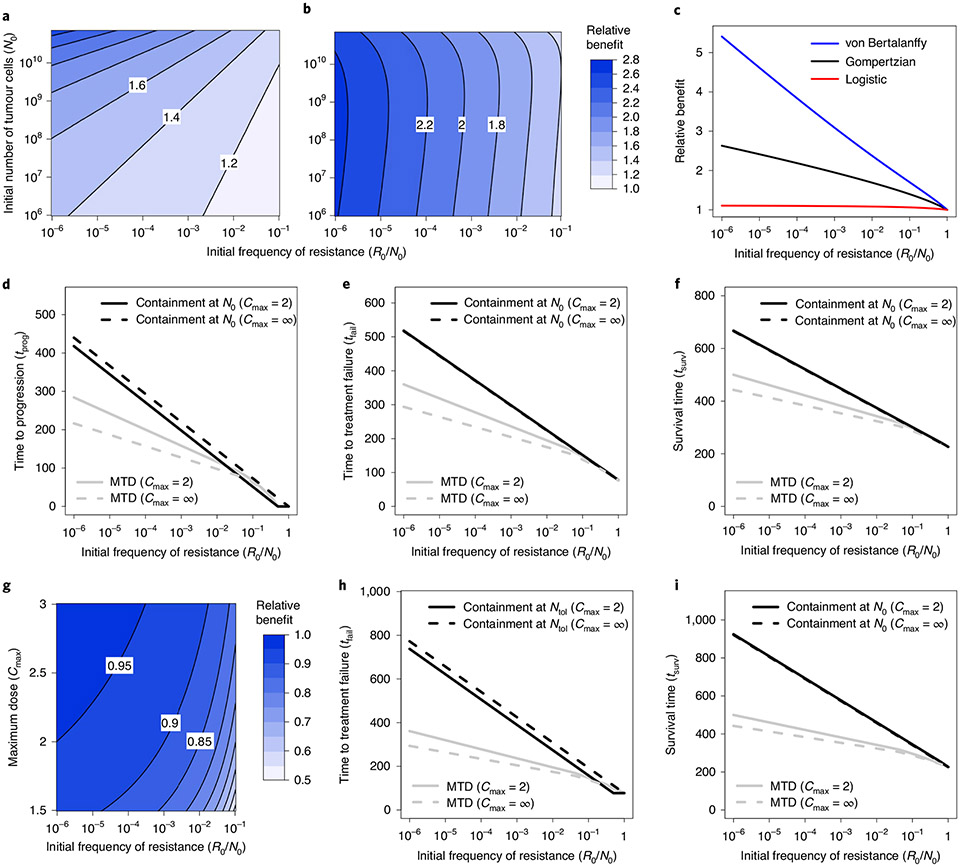
Fig. 2 ∣. Comparison of clinical benefits of containment and MTD treatments in Model 3.
a, Relative benefit, in terms of time to progression, for ideal containment at size N0 versus ideal MTD (that is, ratio tprog(idContN0)/tprog(idMTD)), as a function of initial tumour size and frequency of resistant cells. b, Relative benefit, in terms of time to treatment failure, for ideal containment at size Ntol versus ideal MTD (that is, ratio tfail(idContNtol)/tfail(idMTD)), as a function of initial tumour size and frequency of resistant cells. c, Relative benefit, in terms of time to treatment failure, for ideal containment at size Ntol versus ideal MTD for a Gompertzian growth model (black curve; Model 3), a logistic growth model (red) and a von Bertalanffy growth model (blue). Parameter values for the Gompertzian growth model are as in Table 2. Parameter values of the other models are chosen so that untreated tumour growth curves are similar for tumour sizes between N0 and Ncrit (the lethal size). See Extended Data Fig. 2 for details. d–f, Time to progression (d), treatment failure (e) and survival time (f) versus initial frequency of resistance. Outcomes are shown for MTD treatment and containment at N0, both in the ideal case (Cmax = ∞) and subject to Cmax = 2. g, Relative benefit, in terms of time to treatment failure for containment versus ideal containment (at size Ntol), as a function of maximum dose threshold (Cmax) and initial frequency of resistant cells (the formulas are shown in Supplementary Information, section 3.3). The contour lines are at intervals of 0.05. h,i, Time to treatment failure (h) and survival time (i) versus initial frequency of resistance. Outcomes are shown for MTD treatment and containment at Ntol, both in the ideal case (Cmax = ∞) and subject to Cmax = 2.

