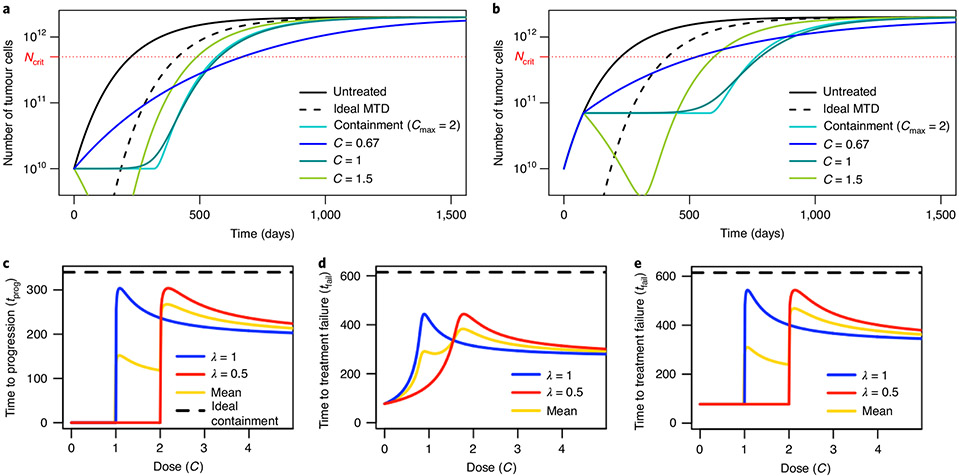
Fig. 3 ∣. Constant dose and delayed constant dose treatments in Model 3.
a, Tumour size for various constant dose treatments compared to containment at the initial size (subject to Cmax = 2) and ideal MTD. b, Tumour size for various delayed constant dose treatments (the dose is applied continuously from the first time when N = Ntol) compared to containment at Ntol (subject to Cmax = 2) and ideal MTD. Until N = Ntol, all curves are the same, except ideal MTD. c, Times to progression for two patients whose tumours differed in treatment sensitivity (parameter λ) under constant dose treatments, as a function of the dose. The yellow line is the mean of the two patient outcomes and the dashed line is the time to treatment failure under ideal containment at N0, which is the same for both patients, and the maximal time to progression. d, Times to treatment failure for two patients whose tumours differed in treatment sensitivity under constant dose treatments, as a function of the dose. The yellow line is the mean of the two patient outcomes and the dashed line is the time to treatment failure under ideal containment at Ntol, which is the same for both patients, and the maximal time to treatment failure. e, Times to treatment failure for two patients whose tumours differed in treatment sensitivity under delayed constant dose treatment. (The dose starts to be applied when N = Ntol for the first time.) The yellow line is the mean of the two patient outcomes and the dashed line is the time to treatment failure under ideal containment at Ntol, which was the same for both patients, and the maximal time to treatment failure.

