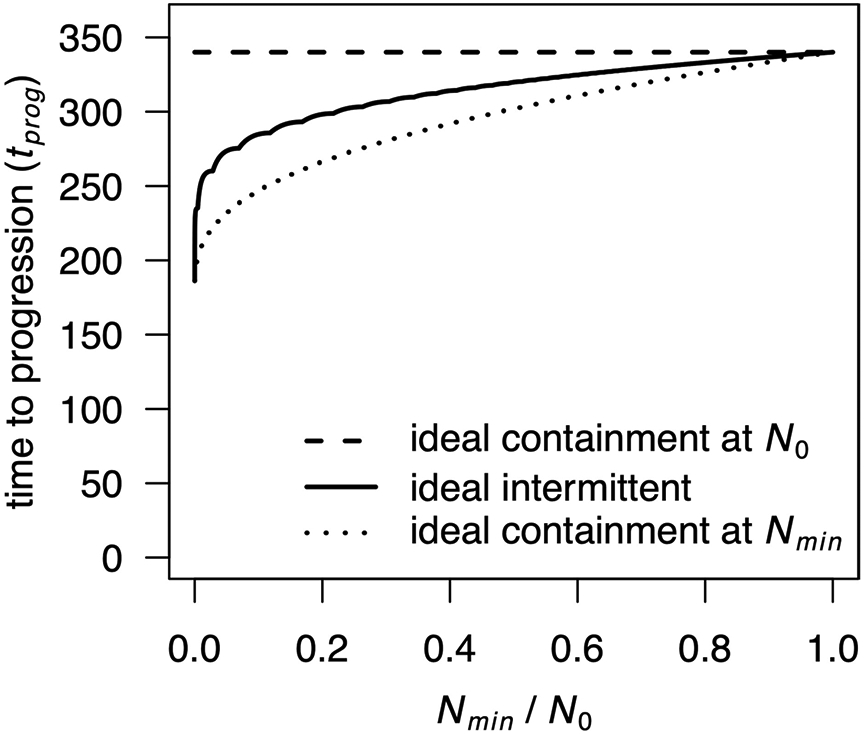
Extended Data Fig. 1 ∣. Ideal intermittent containment between Nmin and Nmax.

Times to progression are shown for ideal intermittent containment between Nmin and N0 for varied Nmin value (solid curve), compared to ideal containment at either N0 (dashed curve) or Nmin (dotted curve), according to a Gompertzian growth model (Model 3 in the main text). Non-varied parameter values are as in main text Table 2. The kinks in the curve for ideal intermittent containment are due to the discontinuity of the treatment when a new cycle is completed, or in mathematical terms, to the integer part that appears in the explicit formula.
