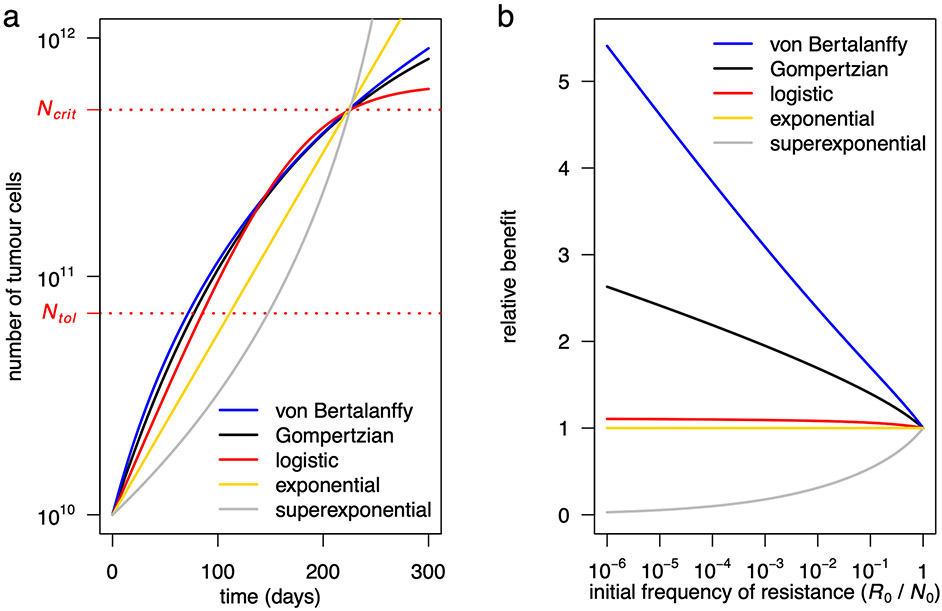
Extended Data Fig. 2 ∣. Outcomes for five models with different forms of density dependence.
a, Untreated tumour growth curves for a Gompertzian growth model (black curve; Model 3 in the main text), a logistic growth model (red), a von Bertalanffy growth model (blue), an exponential model (yellow) and a superexponential model (grey). Parameter values for the Gompertzian growth model are as in Table 2 of the main text. Parameter values of the logistic and von Bertalanffy models are chosen so that their growth curves are similar to the Gompertzian model for tumour sizes between N0 and Ncrit (the lethal size), as would be the case if the models were fitted to empirical data. In the logistic growth model, K = 6.4×10¹¹ and ρ = 2.4×10⁻². In the von Bertalanffy growth model, K = 5×10¹³, ρ = 90 and γ = 1/3 (the latter value is conventional in tumour growth modelling [24, 37]). In the exponential model, ρ = 0.0175. In the superexponential model, ρ = 4.5×10⁻⁶ and γ = 1/3 (the latter value has been inferred from data [32]). b, Relative benefit, in terms of time to treatment failure, for ideal containment (at size Ntol) versus ideal MTD, for the five models with varied initial frequency of resistance (parameter values are the same as in panel a). Note that relative benefits for all models are independent of ρ.

