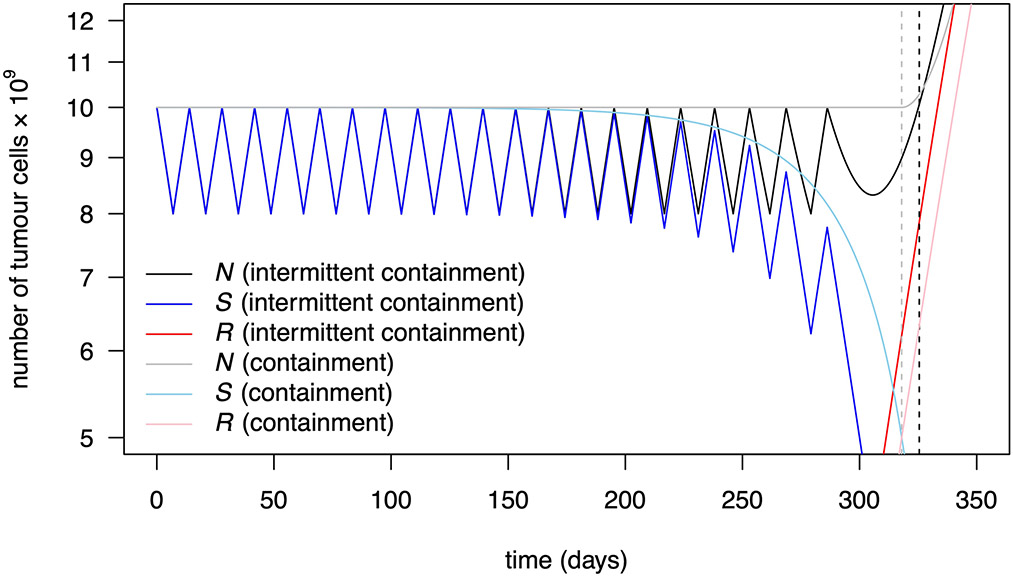
Extended Data Fig. 4 ∣. Containment at N0 and intermittent containment between N0 and 0.8 N0 in a Gompertzian growth model (Model 3 in the main text).
Dashed vertical lines indicate time to progression under containment (dashed grey) and intermittent containment (dashed black). Intermittent containment leads here to a slightly larger time to progression than containment at the upper level. However, as follows from Proposition 6 (Supplementary Material), the resistant population is larger under intermittent containment (red) than under containment (pink). After progression, tumour size quickly becomes larger under intermittent containment (solid black curve) than under containment (solid grey curve). Parameter values are as in Table 2 of the main text.

