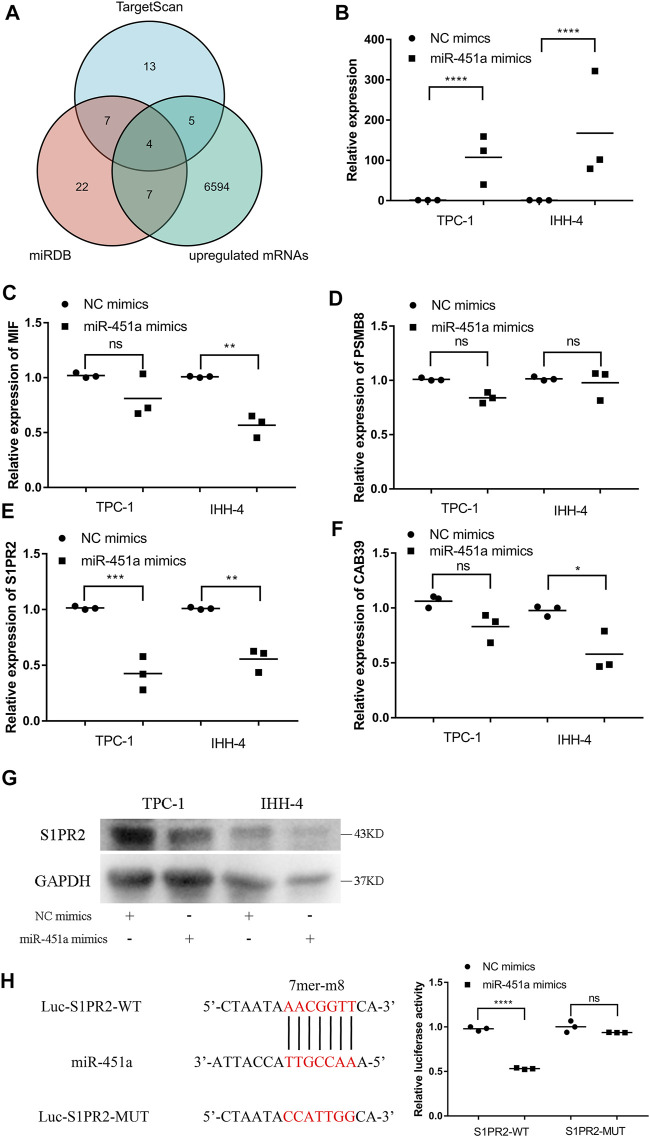
FIGURE 5.
miR-451a targeted S1PR2 in PTC cells. (A) Venn plot of three databases, including TargetScan, miRDB, and upregulated mRNAs in TCGA-THCA. (B) The expression of miR-451a in TPC-1 and IHH-4 cells with the transfection of miR-451a mimics (n = 3). (C) The expression of MIF in TPC-1 and IHH-4 cells with or without miR-451a mimics by qRT-PCR (n = 3). (D) The expression of PSMB8 in TPC-1 and IHH-4 cells with or without miR-451a mimics by qRT-PCR (n = 3). (E) The expression of S1PR2 in TPC-1 and IHH-4 cells with or without miR-451a mimics by qRT-PCR (n = 3). (F) The expression of CAB39 in TPC-1 and IHH-4 cells with or without miR-451a mimics by qRT-PCR (n = 3). (G) The expression of S1PR2 protein in TPC-1 and IHH-4 cells with or without miR-451a mimics by western blot assay. (H) A putative interaction site with miR-451a in S1PR2 was predicted and verified by dual-luciferase reporter assay in TPC-1 cell (n = 3). *p < 0.05; **p < 0.01; ***p < 0.001; ****p < 0.0001.

