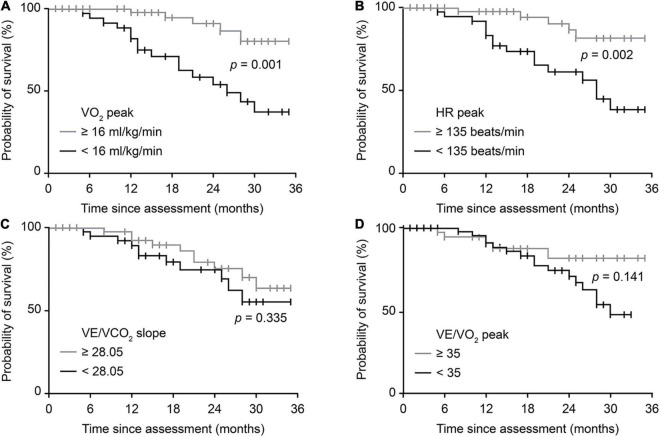
FIGURE 4.
Survival probability predicted by typical CPET variables. Crude Kaplan-Meier curves during follow-up for (A) overall exercise capacity, represented by the VO2 peak, (B) cardiovascular function, represented by HR peak, (C) pulmonary function, represented by VE/VCO2 slope, and (D) breathing economy, represented by the VE/VO2 peak. The cutoff value for the VO2 peak was defined by previous studies. The cutoff values for the remaining three variables were based on the medians of patients in this study. |, censored patients. ALS, amyotrophic lateral sclerosis; CPET, cardiopulmonary exercise testing; VO2, oxygen consumption; HR, heart rate; VE, minute ventilation; VCO2, carbon dioxide production.

