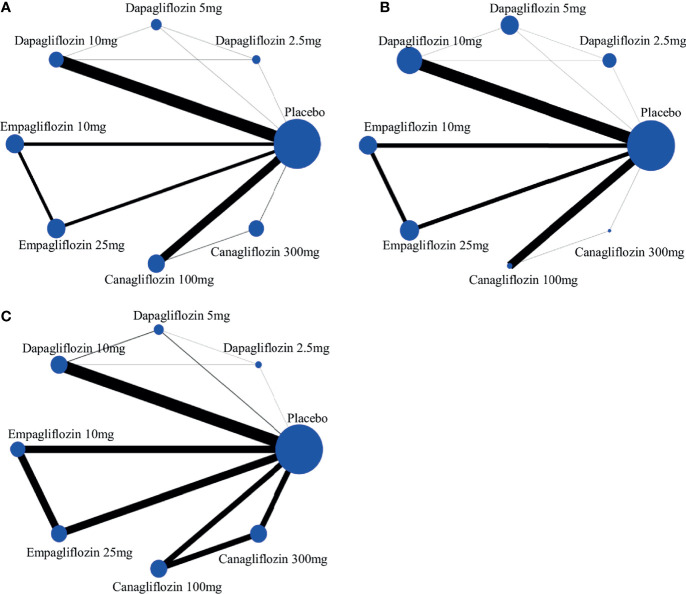
Figure 2.
The evidence network of studies reporting (A) all-cause death, (B) cardiovascular event and (C) volume depletion. The size of the nodes (blue circles) corresponds to the overall sample size of the corresponding intervention. Each line represents the direct comparison between the two interventions, and its thickness corresponds to the number of trials that assessed the comparison.

