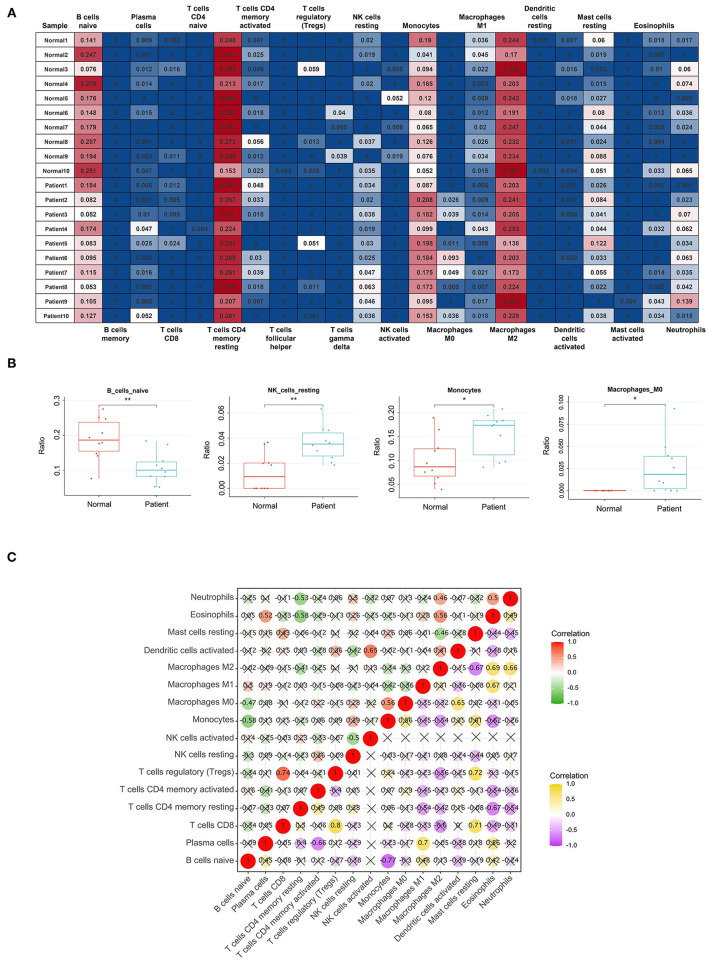
Figure 8.
Results of Immune Cell Infiltration analysis. (A) The percentages of immune cells in each sample of GSE153434; (B) The content of B cells naive, NK cells resting, Monocytes and Macrophages M0 in normal aortic samples and AAD samples. *Represented p < 0.05. **Represented p < 0.01; (C) The relationships of immune cells in all samples and in AAD samples only, the correlation analysis of immune cells of all samples is shown in red and green, with red representing positive correlation and green representing negative correlation. The correlation analysis of immune cells of only AAD samples is represented by purple and yellow, yellow represents positive correlation, and purple represents negative correlation.

