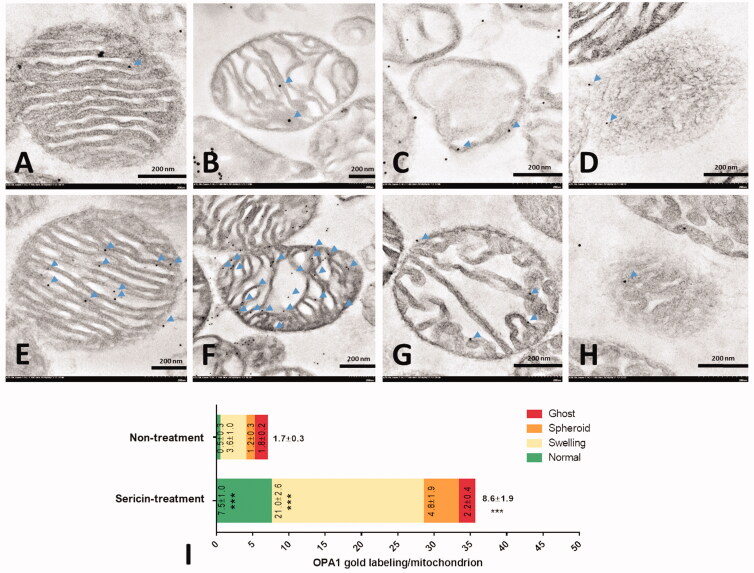
Figure 2.
OPA1 immunogold labelling in extracted heart mitochondria was observed by electron microscopy: Non-treatment (A–D) and sericin-treatment (E–H) with OPA1 gold labelling (arrow) at heart mitochondrial stages: normal (A,E), swelling (B,F), spheroid (C,G), and ghost (D,H). Bar graph (I) is demonstrated of gold labelling by mean ± SEM comparing each mitochondrial stage; normal (green), swelling (yellow), spheroid (orange), and ghost (red), between non-treated and sericin-treated rats.

