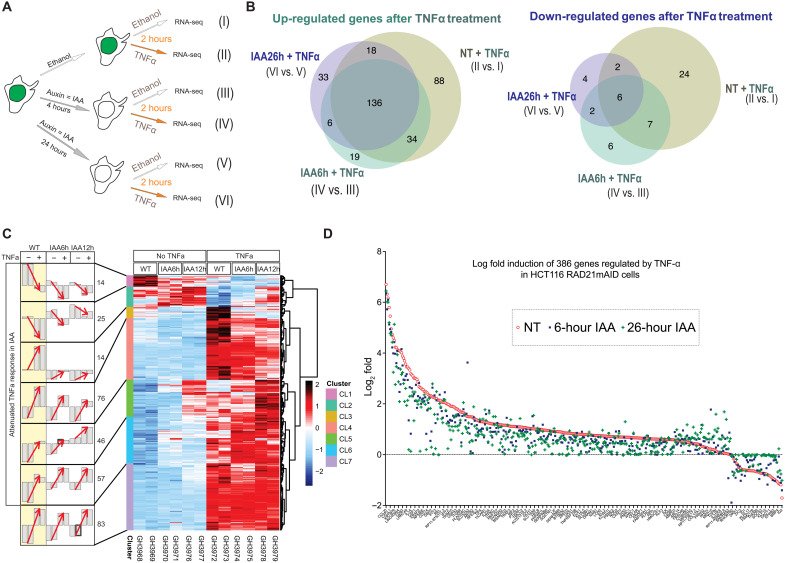
Fig. 6. NF-kB response to TNF-α treatment is weakened after cohesin loss, suggesting that inducible TFs promote gene expression through the cohesin complex.
(A) Schematic representation of RNA-seq experiments after double treatment of dexamethasone and auxin of the HCT116 RAD21mAID cells (n = 2 independent biological replicates). (B) Venn diagram showing up-regulated genes (left) and down-regulated genes (right) after 2 hours of TNF treatment in untreated cells, 6-hour IAA-treated cells, and 26-hour IAA-treated HCT116 RAD21mAID cells (II versus I, IV versus III, and VI versus V). Differentially expressed genes (DEGs) were obtained by DESeq2 using threshold of adjusted P < 0.05 and fold change of 1.5. (C) Right: Heatmap summarizing 315 DEGs that are the union of (B). Left: Biological duplicates are shown as two individual bars under each condition. The y axis of each bar represents the average of z-scored values of variance stabilizing transformed gene expression values in each cluster. Red arrows indicate the response to TNFa treatment under WT, IAA6h, and IAA24h based on average expression profiles. CL1 and CL2 show the attenuated suppression response by TNFa under IAA treatment. CL3, CL4, CL5, and CL6 show the attenuated induction response (with various degrees) by TNFa under IAA treatment. CL7 contains genes less affected by IAA. (D) Log2 fold changes estimated from DESeq2 of TNF-α–regulated genes (n = 386) in (B). Genes are sorted on the basis of the fold change values by TNF-α treatment in IAA-untreated cells to compare the trend of attenuated TNF-α treatment response in IAA-treated cells.

