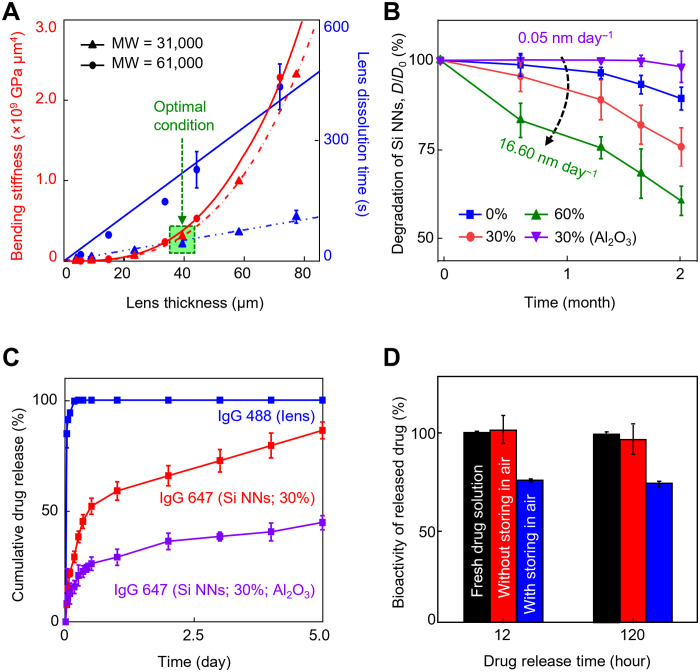
Fig. 4. Dissolution kinetics and drug release kinetics.
(A) Measurement results of the bending stiffness (red lines) and dissolution time (blue lines) of the tear-soluble contact lens when immersed in 5 ml of the simulated tear fluid at 37°C as a function of the thickness ranging from 4 to 80 μm with molecular weights (MW) of 31,000 (triangular symbols) and 61,000 (circular symbols). All data are represented as means ± SD, with n = 5 for each group. (B) Dissolution of Si NNs in a 1.4% (w/v) agarose gel containing 1 ml of the simulated tear fluid at 37°C for 2 months with varied surface porosity ranging from 0 to 60% and with the presence of a 3-nm-thick pinhole-free Al2O3 layer. All data are represented as means ± SD, with n = 5 for each group. (C) Cumulative release of IgG 488 and 647 for 120 hours immersed in 1 ml of the simulated tear fluid at 37°C, each of which was physically and covalently loaded in the tear-soluble contact lens (blue line) and on the surface of Si NNs (i.e., porosity = 30%) with (red line) and without (purple line) the presence of the Al2O3 passivation layer. All data are represented as means ± SD, with n = 3 for each group. (D) Results of ELISA to quantify the bioactivity of Bev at 12 and 120 hours of release from Si NNs after storage in a refrigerator at 4°C for 1 day (red bars) and 3 days (blue bars), as compared to a new vial of fresh Bev solution as a control (black bars). All data are represented as means ± SD, with n = 3 for each group.

