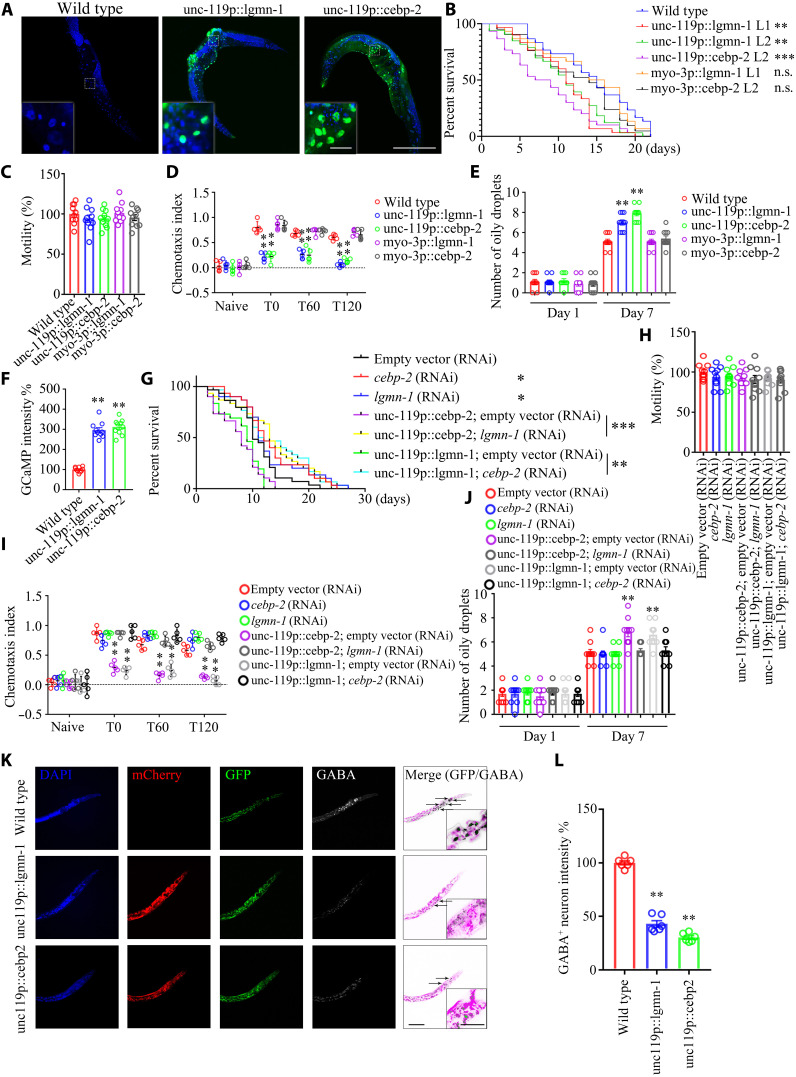
Fig. 5. Neuronal overexpression of C/EBPβ or AEP shortens the life span in C. elegans, associated with neural excitation, related to figs. S8 and S9.
(A) GFP signal from neurons in transgenic lines. Scale bars, 200 μm and 20 μm (inset). (B) Neuronal but not muscle overexpression of lgmn-1 or cebp-2 reduces the life span of worm. (n = 30 worms per group; P < 0.0001, log-rank test; **P < 0.01 and ***P < 0.001 versus WT). n.s., not significant. (C) Motility assay. Shown are mean motility scores for the first 30 s. (n = 10 worms per group). (D) CTX assay. Data were analyzed by two-way ANOVA and Sidak’s multiple comparisons test (n = 14 to 20 worms per experiment from five independent experiments). Color circles represent the individual CIs. (E) Oily droplet characterization. Data are represented as means ± SEM (day 7; two-way ANOVA and Sidak’s multiple comparisons test; **P < 0.01). (F) Neural excitation assay. Quantification of GCaMP fluorescence changes in adult day 2 worms: n = 10 worms per group. **P < 0.01 versus WT. (G) Knocking down lgmn-1 or cebp-2 by RNAi reverses life-span reduction by neuronal overexpression lgmn-1 or cebp-2. n = 30 worms per group. P < 0.0001, log-rank test; *P < 0.05, **P < 0.01, and ***P < 0.001. (H) Motility assay. n = 10 worms per group. (I) CTX assay. Data were analyzed by two-way ANOVA and Sidak’s multiple comparisons test (n = 14 to 20 worms per experiment from five independent experiments). (J) Oily droplet assay. Data are presented as means ± SEM (day 7; two-way ANOVA and Sidak’s multiple comparisons test; **P < 0.01). (K) Neuronal overexpression of lgmn-1 or cebp-2 induces GABAnergic neuronal degeneration in worms. Scale bars, 40 μm and 10 μm (inset). (L) Quantification of GABA+ neurons’ fluorescence intensity in day 2 worms. Data are represented as means ± SEM; n = 10 worms per group. **P < 0.01 versus WT; Mann-Whitney U test with multiple testing correction by Holm’s method.

