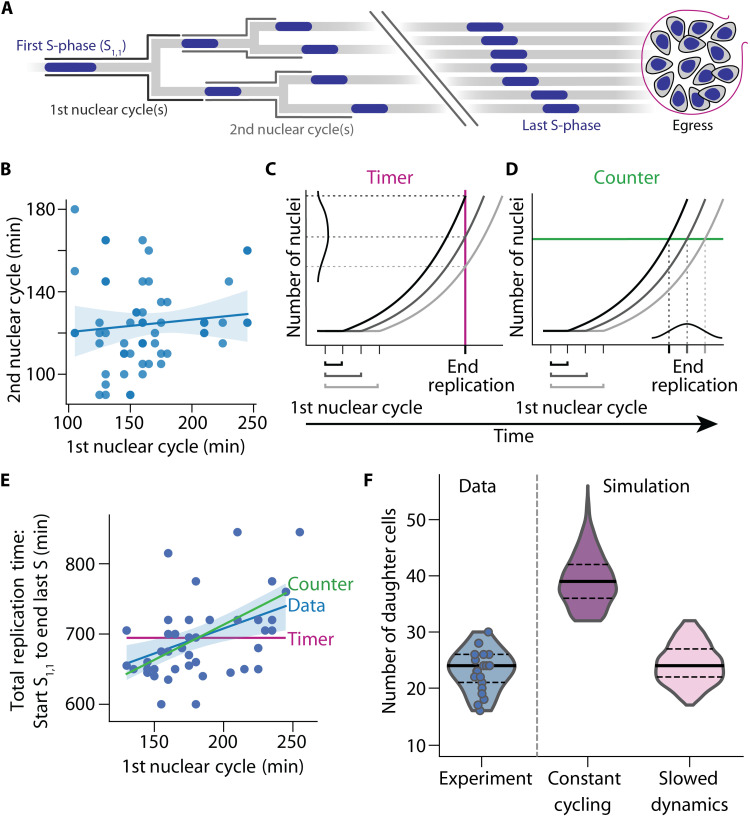
Fig. 4. Simulation of P. falciparum proliferation predicts slowing nuclear cycle dynamics.
(A) Nuclear lineage tree illustrating events of P. falciparum proliferation that were quantified in single parasites. S-phases depicted blue; nuclear cycles are defined as the total time from the start of an S-phase until the start of ensuing S-phases. Break indicates events that could not be individually resolved in the experiments. (B) The duration of the first and second nuclear cycles showed no correlation (Spearman’s ρ = 0.14, n = 58, P = 0.28); solid line, linear regression; band, bootstrapped 95% confidence interval. (C and D) Schematic illustrating how the duration of the first nuclear cycle affects the time needed to complete nuclear multiplication. (C) Timer mechanism with a set total time (red line) predicts no correlation. (D) Counter mechanism with a set total number of nuclei (green line) predicts a positive correlation. (E) Time-lapse imaging data showed a positive correlation between duration of first nuclear cycle and total time needed, i.e., time from start S1,1 to end of last S-phase (ρ = 0.42, n = 46, P = 0.0034), supporting a counter mechanism and contradicting a timer mechanism; blue solid line and band, linear regression and bootstrapped 95% confidence interval; red solid line, timer prediction; green solid line, counter prediction if all events were synchronous. (F) Mathematical model with slowing nuclear cycling dynamics (17% per cycle) fitted the experimental data best; solid lines, median; dashed lines, quartiles.

