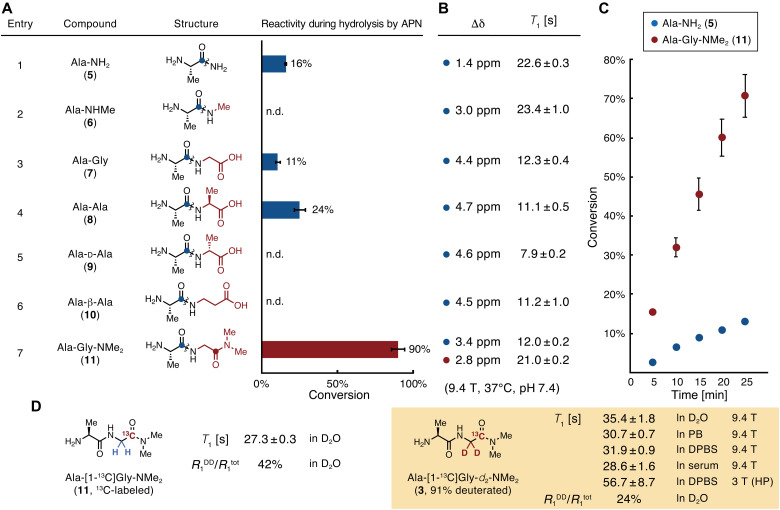
Fig. 3. Reaction efficiencies for APN, chemical shift changes, and spin-lattice relaxation times of APN probe candidates.
(A) A series of probe candidates and their conversion rates during enzymatic reactions with APN. Conditions: 3.0 mM compound in 100 mM phosphate buffer (pH 7.4), hAPN (9.7 nM), 37°C, 40 min, n = 3. Wavy lines indicate bonds that are cleaved by APN. (B) Magnetic parameters of the 13C atoms in probe candidates, highlighted as blue or red circles in (A). Δδ, change in 13C chemical shift between probe and product generated by hydrolysis by APN. Measurement conditions, 100 mM each of the probe and product in phosphate buffer [90 mM (pH 7.4)] containing 10% D2O, 37°C. T1, spin-lattice relaxation time. Measurement conditions, 500 mM compound in phosphate buffer [90 mM (pH 7.4)] containing 10% D2O, 37°C, 9.4 T. (C) Time course of Ala-NH2 (5) and Ala-Gly-NMe2 (11) conversion by APN. Conditions, 3.0 mM compound in phosphate buffer [100 mM (pH 7.4)], hAPN (9.7 nM), 37°C, n = 3. (D) T1 values and contributions of R1DD of Ala-[1-13C]Gly-NMe2 and Ala-[1-13C]Gly-d2-NMe2. Measurement conditions, 10 mM compound in D2O (In D2O), in phosphate buffer [90 mM (pH 7.4)] containing 10% D2O (In PB), in DPBS containing 10% D2O (In DPBS), or in human serum containing 10% D2O (In serum), 37°C, 9.4 T; 3 T (HP), ca. 1.4 mM compound in DPBS containing 3.4 mM glycerol, 32 μM OX063, and 227 μM EDTA, 37 °C, 3.0 T under a hyperpolarized state. R1DD, inverse of T1 relaxation time by dipole-dipole interaction; R1tot, the total value of the inverse of T1 relaxation times. HP, hyperpolarized state. Error bars indicate the SD. n.d. indicates that the product (Ala) was not detected.

