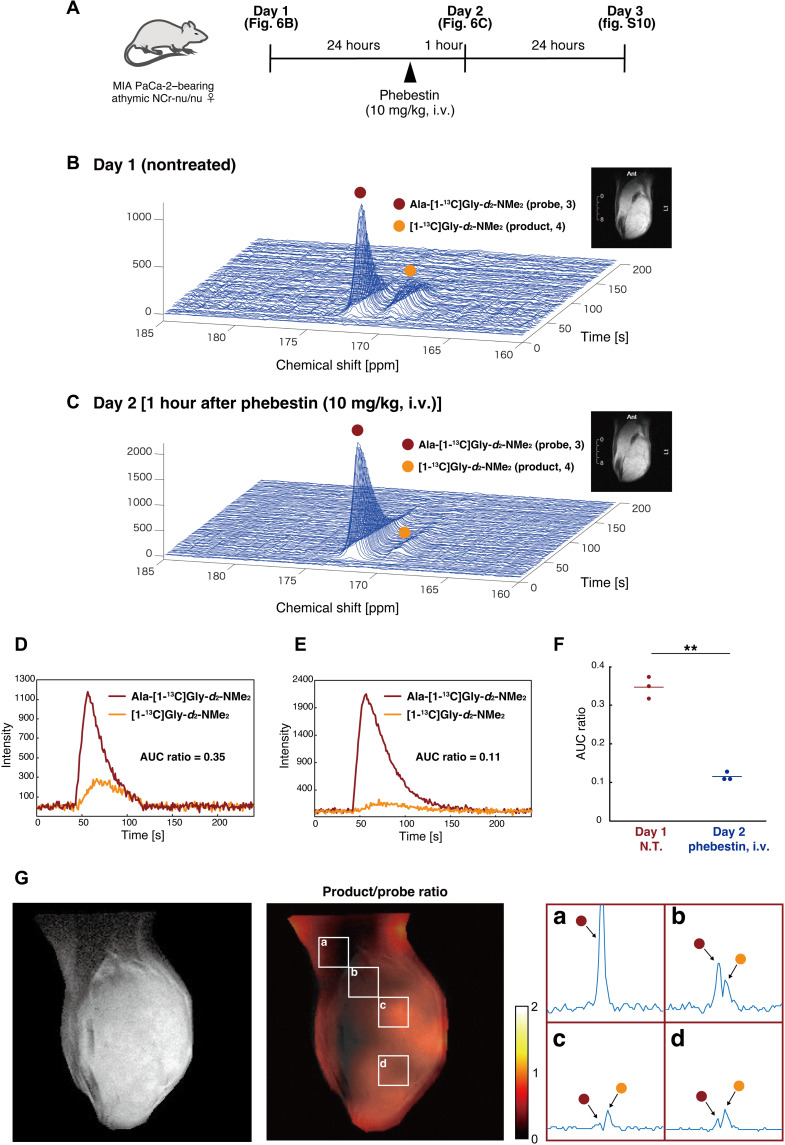
Fig. 6. Detection of APN activity with hyperpolarized Ala-[1-13C]Gly-d2-NMe2 in vivo.
(A) Schematic representation of the experimental outline. i.v., intravenously. (B and C) Time series of 13C NMR spectra acquired in vivo with the coil placed over the leg tumor after intravenous injection of hyperpolarized probe 3. Inset: an example of the anatomical images from the observed area (1H MRI). (D and E) Time course plots of 13C signals of Ala-[1-13C]Gly-d2-NMe2 (3) (red line) and [1-13C]Gly-d2-NMe2 (4) (orange line) in (B) and (C). (F) Dot plot of the AUC ratio on days 1 and 2 (n = 3 and P = 0.009). The experiments were performed using 40 μl (n = 1) and 80 μl (n = 2) of the probe solution for hyperpolarization. AUC, area under the curve. N.T., nontreated. G) CSI of a mouse leg bearing xenograft tumor (MIA PaCa-2). Left: Anatomical image from the observed area (T2-weighted 1H MRI). Middle: Image of the product (4) to the probe (3) ratio. Right: Expanded spectra in representative voxels a to d. The voxel size is 2.8 mm × 2.8 mm × 10 mm. The left peak is Ala-[1-13C]Gly-d2-NMe2 (3; red circle), and the right peak is [1-13C]Gly-d2-NMe2 (4; orange circle). 13C spectra are with denoising process. The image was acquired at 18 to 26 s after injection of the hyperpolarized probe.

