FIGURE 4.
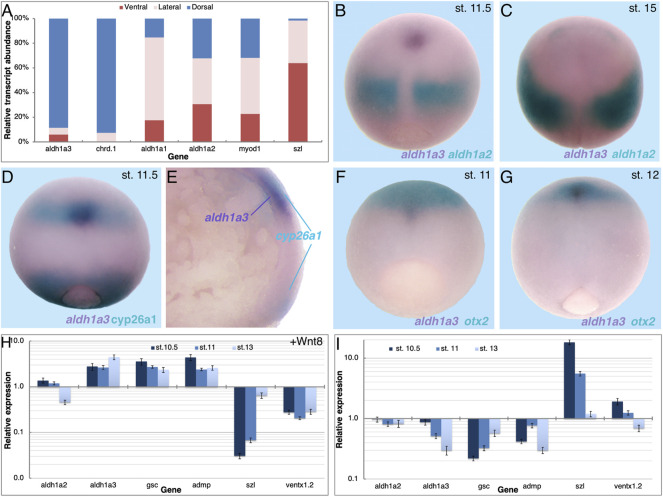
Expression of aldh1a3 in the migrating LEM/PCM cells. (A) Mid-gastrula embryos (st. 11) were dissected into dorsal, lateral, and ventral regions, and RNA was extracted from each region. The relative abundance of aldh1a1, aldh1a2, and aldh1a3 was studied by qPCR. The accuracy of the dissections was determined by qPCR of chrd.1, myod1, and szl as dorsal, lateral, and ventral markers, respectively. In comparison to the szl transcript distribution, all other genes had a significantly different distribution, p < 0.0001 using the Fisher exact probability test. Spatial expression pattern comparison between aldh1a3 and aldh1a2 (B,C), aldh1a3 and cyp26a1 (D,E), and aldh1a3 and otx2 (F,G). (B–D,F,G) dorsal view, anterior to the top. (H,I) Embryos were injected with mRNA encoding WNT8a (H) or BMP4 (I) and samples were collected during early and mid-gastrula, and early neurula stages (st. 10.5, 11, and 13). qPCR analysis was performed for aldh1a2 and aldh1a3, the dorsal markers gsc and admp, and the ventral genes szl and ventx1.2. Relative expression was normalized to levels in control embryos. Groups of injected embryos were incubated to tailbud stages to determine their dorsoanterior index (DAI) (Kao and Elinson, 1988). wnt8a, DAI = 5.67; bmp4, DAI = 3.64.

