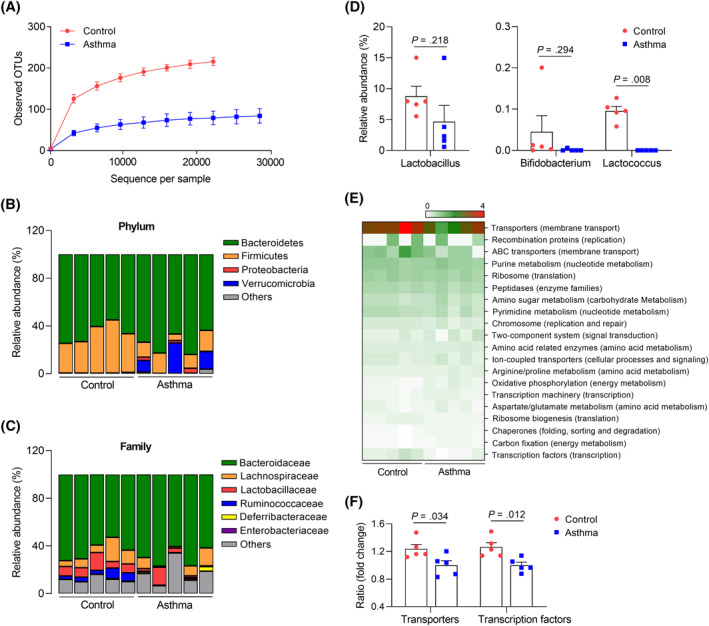
FIGURE 1.

Alterations in the gut microbiota in allergic asthma in vivo. (A) Operational taxonomic units (OTUs). Data are presented as mean ± SD, n = 5. Investigation of microbial communities from the feces at the (B) phylum, (C) family, and (D) genus levels. (E) Heatmap plot of functional‐gene profiles. (F) The relative abundance of genes related to transporters and transcriptional factors. Data are presented as box plots, n = 5. p values were obtained by Student's t test
