
FIGURE 2.
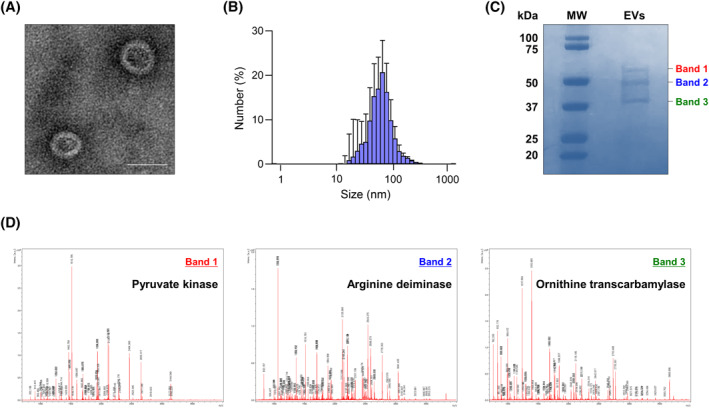
Characterization of EVs derived from probiotics. (A) EV image observed using transmission electron microscopy. Scale bar, 50 nm. (B) EV size measured using a dynamic light‐scattering analyzer. Data are represented as mean ± SD, n = 5. (C) Protein components in the EVs analyzed by sodium dodecyl‐sulfate polyacrylamide gel electrophoresis (D) Identification of specific proteins by peptide mass fingerprinting