
FIGURE 1.
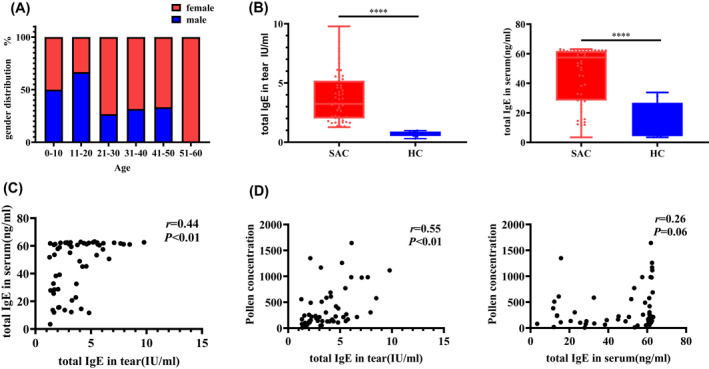
(A) Age distribution of the enrolled patients. (B) Comparison of the baseline levels of the total IgE concentration in tears (left panel) and serum (right panel). The differences between groups were compared using the two‐tailed Mann–Whitney U test. (C) Correlation between tear and serum total IgE levels. (D) Correlation between pollen concentration and total IgE in tears (left panel), and total IgE in serum (right panel). HC, healthy control group (n = 10), AC: SAC group (n = 55). The association between variables was studied by calculating the Spearman's correlation coefficient