FIGURE 2.

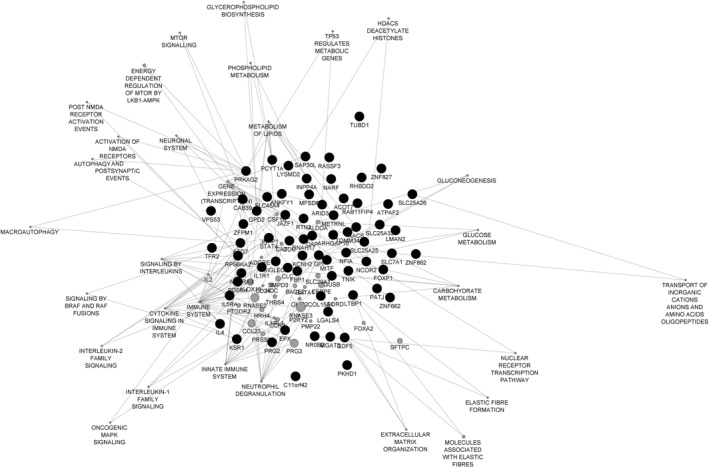
Cytoscape diagram presenting the network of common differentially methylated genes in at least three studies and the enriched pathways are implicated using reactome‐pathway analysis tool

Cytoscape diagram presenting the network of common differentially methylated genes in at least three studies and the enriched pathways are implicated using reactome‐pathway analysis tool