
FIGURE 6.
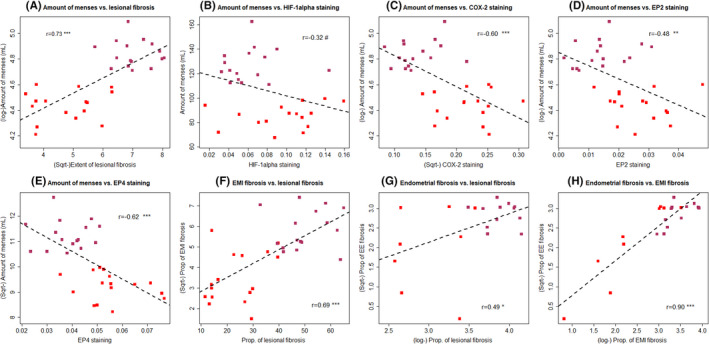
Scatter plot of menstrual blood loss (MBL) versus (A) the extent of lesional fibrosis, (B) HIF‐1α, (C) COX‐2, (D) EP2, (E) EP4 immunostaining levels, (F) the extent of tissue fibrosis in endometrial–myometrial interface (EMI) vs. the extent of lesional fibrosis, (G) the extent of tissue fibrosis in endometrium vs. the extent of lesional fibrosis, and (H) the extent of tissue fibrosis in endometrial–myometrial interface (EMI) vs. the extent of fibrosis in endometrium, in patients with adenomyosis complaining of moderate–heavy MBL (MHB, red‐colored dots) and excessive MBL(EXB, purple‐colored dots). The dashed line represents the regression line. The number shown is the correlation coefficient, along with the symbol showing the levels of statistical significance. The definitions for MHB and EXB are given in the text and Figure 1. Symbols for statistical significance levels: NS: p > 0.05; *: p < 0.05; **: p < 0.01; ***: p < 0.001; #: p > 0.05. HIF‐1α indicates hypoxia inducing factor 1α; COX‐2, cyclooxygenase‐2; EP2 and EP4, E‐series of prostaglandin receptors Type 2 and Type 4; EMI: endometrial–myometrial interface