FIGURE 2.

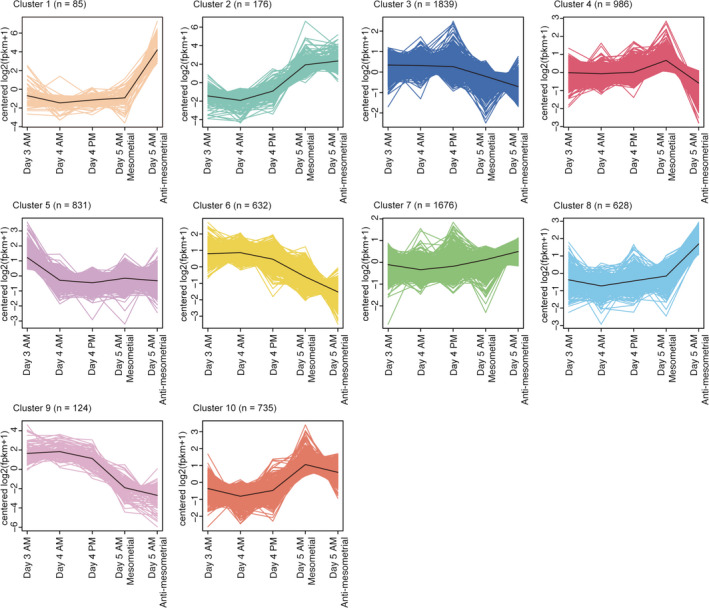
K‐means clustering shows differential gene kinetics during the peri‐implantation period. Ten different clusters were revealed by k‐means clustering. The numbers of genes in each cluster are shown on the top of each graph

K‐means clustering shows differential gene kinetics during the peri‐implantation period. Ten different clusters were revealed by k‐means clustering. The numbers of genes in each cluster are shown on the top of each graph