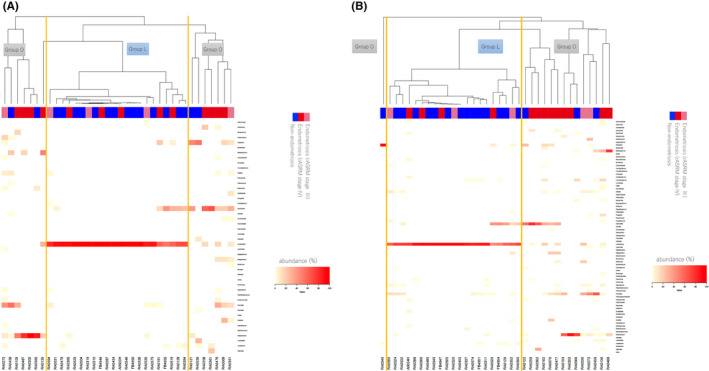
FIGURE 2.

Clustering analysis. (A) The clustering analysis of vagina at the genus level. Group L = Group which the highest abundance of bacteria was Lactobacillus. Group O = Group which the highest abundance of bacteria was except Lactobacillus. There were significantly many endometriosis cases in Group O in the vaginal microbiome (p = 0.04). (B) The clustering analysis of endometrium at the genus level. There were significantly many endometriosis cases in Group O in the endometrial microbiome (p = 0.02)
